
KYT graph analytics in 2026
By 2026, know-your-transaction (KYT) systems have moved beyond simple address flagging. They now rely on real-time graph analytics to trace the complex web of connections between wallets, exchanges, and smart contracts. This shift allows compliance teams to see the full journey of funds, not just the final destination.
The core change is the ability to process transaction graphs as they happen. Instead of waiting for end-of-day batch reports, platforms now analyze hundreds of thousands of links per second. This immediacy is critical for stopping fraud before assets leave a user’s account or mix into a tumbler.
Think of graph analytics as a real-time map of financial relationships. Each node is a wallet or entity, and each edge is a transaction. In 2026, these maps are updated instantly, allowing systems to spot suspicious patterns like rapid layering or circular trading before they complete.
This capability has become a regulatory expectation rather than a nice-to-have. Major jurisdictions now require institutions to demonstrate they can trace high-risk flows in real time. Firms that lag behind face stricter scrutiny and higher operational risks.
The technology relies on specialized graph databases that handle high-velocity data. These systems store relationships as first-class citizens, making it easy to query paths across multiple hops. This structure is far more efficient than traditional relational databases for tracing cross-chain movements.
As the crypto ecosystem grows more complex, the volume of data increases exponentially. Graph analytics provide the scalability needed to keep up. They allow compliance teams to focus on high-risk alerts rather than sifting through millions of benign transactions.
Kyt graph analytics 2026 choices that change the plan
Choosing a KYT solution in 2026 means balancing speed, accuracy, and cost. You need to evaluate how different platforms handle real-time data ingestion, graph traversal complexity, and regulatory reporting. The right choice depends on your specific transaction volume and risk tolerance.
| Feature | Real-Time Streaming | Batch Processing | Hybrid Approach |
|---|---|---|---|
| Latency | Sub-second | Hours to days | Minutes |
| Data Freshness | Immediate | Delayed | Near-real-time |
| Compute Cost | High | Low | Medium |
| Use Case | High-frequency trading | End-of-day reporting | Mixed workflows |
Real-time streaming platforms offer the fastest detection but require significant infrastructure investment. Batch processing is cheaper but leaves a window for fraudsters to exploit delays. A hybrid approach often provides the best balance, allowing you to catch immediate threats while performing deeper analysis later.
| Feature | Real-Time | Batch | Hybrid |
|---|---|---|---|
| Latency | Sub-second | Hours | Minutes |
| Cost | High | Low | Medium |
| Complexity | High | Low | Medium |
Choose the next step
Implementing real-time graph analytics is a structural shift, not just a software upgrade. To prevent $50B in fraud, you must move from reactive transaction monitoring to proactive network analysis. The following framework guides you through the operational decisions required to deploy KYT systems that catch illicit flows before they settle.
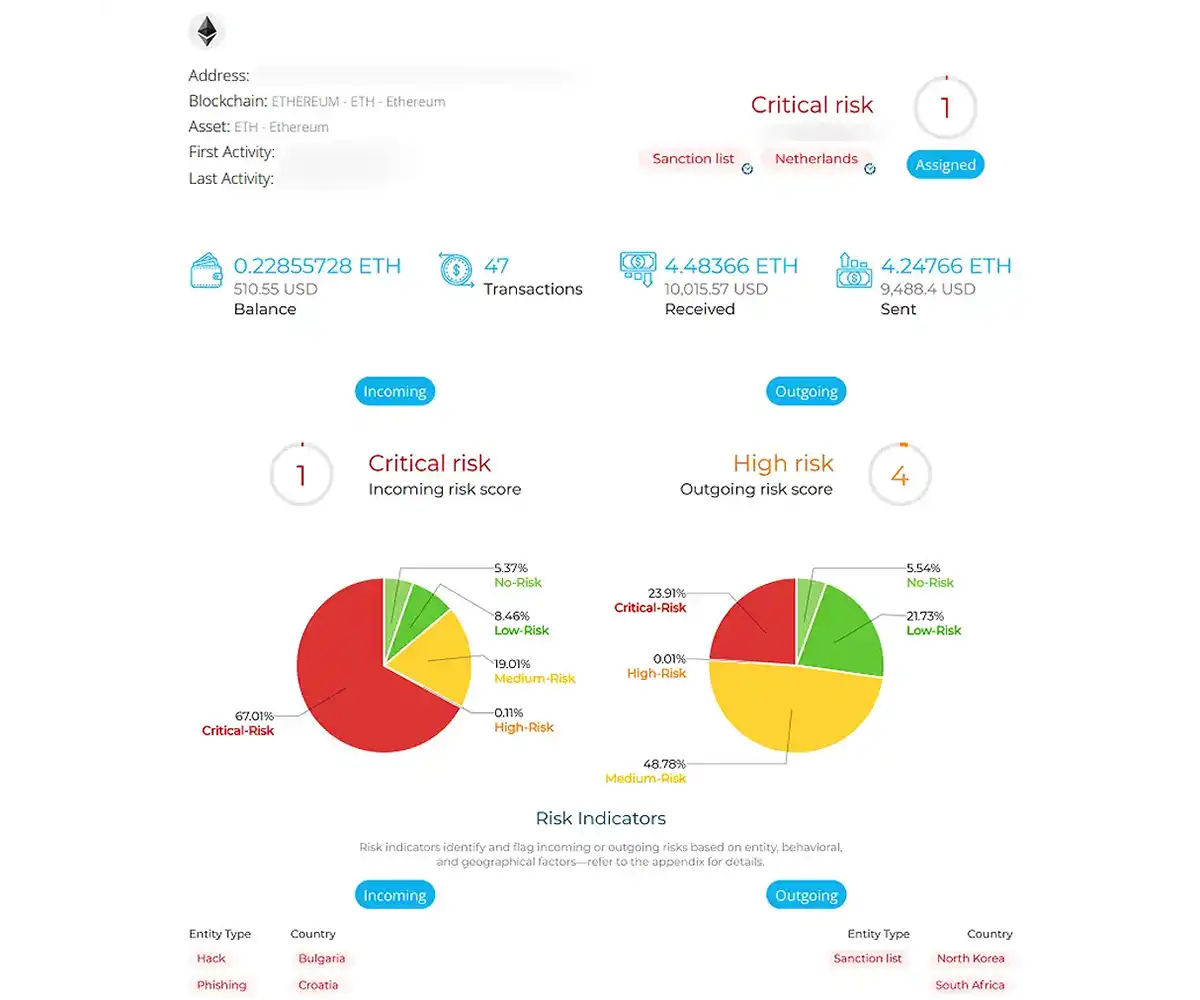
Start by identifying your highest-risk entry points. In 2026, fraudsters exploit cross-chain bridges and decentralized exchanges more than centralized wallets. Map the specific protocols where your users originate funds. Focus your graph analytics on these corridors first, as they offer the highest return on investment for fraud detection.
Latency is the enemy of prevention. You must configure your system to flag suspicious patterns within seconds, not hours. Set dynamic thresholds for velocity and value. A sudden spike in transaction frequency from a new wallet should trigger an immediate hold, regardless of the total amount. Static rules miss complex layering; dynamic thresholds catch them.

Analysts need to see the connections, not just the data. Embed graph visualization tools directly into your compliance dashboard. When a flag is raised, allow reviewers to click through the transaction graph to see the source and destination clusters. This visual context speeds up investigation time by allowing teams to spot entire networks of fraudulent activity at once.
| Detection Method | Response Time | False Positive Rate |
|---|---|---|
| Static Rules | Hours | High |
| Real-Time Graph | Seconds | Medium |
The choice between static rules and real-time graph analytics determines your exposure. Static rules are easier to implement but fail against sophisticated, multi-hop fraud. Real-time graph analytics require more infrastructure but provide the speed and depth needed to stop large-scale fraud in 2026. Choose the path that matches your risk tolerance and technical capacity.
Spotting Weak KYT Options
Not all real-time graph analytics tools deliver the promised fraud prevention. Many vendors rely on static rule engines rather than dynamic graph traversal, missing the complex cross-chain transactions that define modern crypto fraud. When evaluating KYT solutions, focus on the underlying graph technology and latency metrics.
Beware of platforms that claim instant detection but fail to update risk scores in real-time. A genuine graph analytics engine processes transaction paths as they occur, identifying suspicious clusters before funds are withdrawn. If a tool requires batch processing or has significant delays, it is likely too slow to stop active exploits.
Another common pitfall is vague reporting. Effective KYT should provide clear, actionable insights into transaction risk rather than generic alerts. Look for tools that offer granular visibility into wallet connections and transaction patterns. This level of detail is essential for compliance teams and forensic investigators alike.
Finally, verify the data sources. Weak options often rely on limited or outdated blockchain data, leading to false positives or missed threats. Strong platforms integrate multiple data feeds and continuously update their knowledge graphs. This ensures accurate risk assessment and helps you stay ahead of evolving fraud tactics.
Kyt graph analytics 2026: what to check next
How does graph analytics differ from traditional screening tools? Traditional screening relies on static watchlists, which miss complex money laundering structures. Graph analytics maps the relationships between addresses in real time, revealing hidden connections like layering and mixing that simple keyword checks ignore.
Is KYT graph analytics fast enough for high-frequency trading? Yes. Modern graph databases process millions of nodes per second. This speed allows exchanges to flag suspicious transactions during the confirmation window, preventing fraud before funds are withdrawn.
What are the main risks of relying on graph data? Graph data can be noisy. False positives occur when innocent addresses interact with tainted ones. Effective KYT requires tuning sensitivity thresholds to balance security with user experience, avoiding unnecessary transaction delays.
How will AI change KYT in 2026? AI integrates with graph structures to predict future illicit behavior. By learning from historical fraud patterns, AI helps analysts prioritize high-risk clusters, making investigations faster and more accurate.
No comments yet. Be the first to share your thoughts!