
What the KYT graph tracks
A KYT (Know Your Transaction) graph maps the movement of funds across a blockchain, treating wallet addresses as nodes and transactions as connecting lines. Unlike static address screening, which checks a single point against a blacklist, graph analytics follows the trail of assets as they move through multiple hops and mixers. This network view reveals the origin and destination of funds, even when layers of obfuscation are applied.
The system monitors activity in real time, generating alerts within seconds of a transaction occurring on-chain Chainalysis. This rapid detection enables proactive blocking of high-risk flows before they settle. By visualizing these connections, compliance teams can identify clusters of related addresses that might otherwise appear unrelated in a simple ledger review.
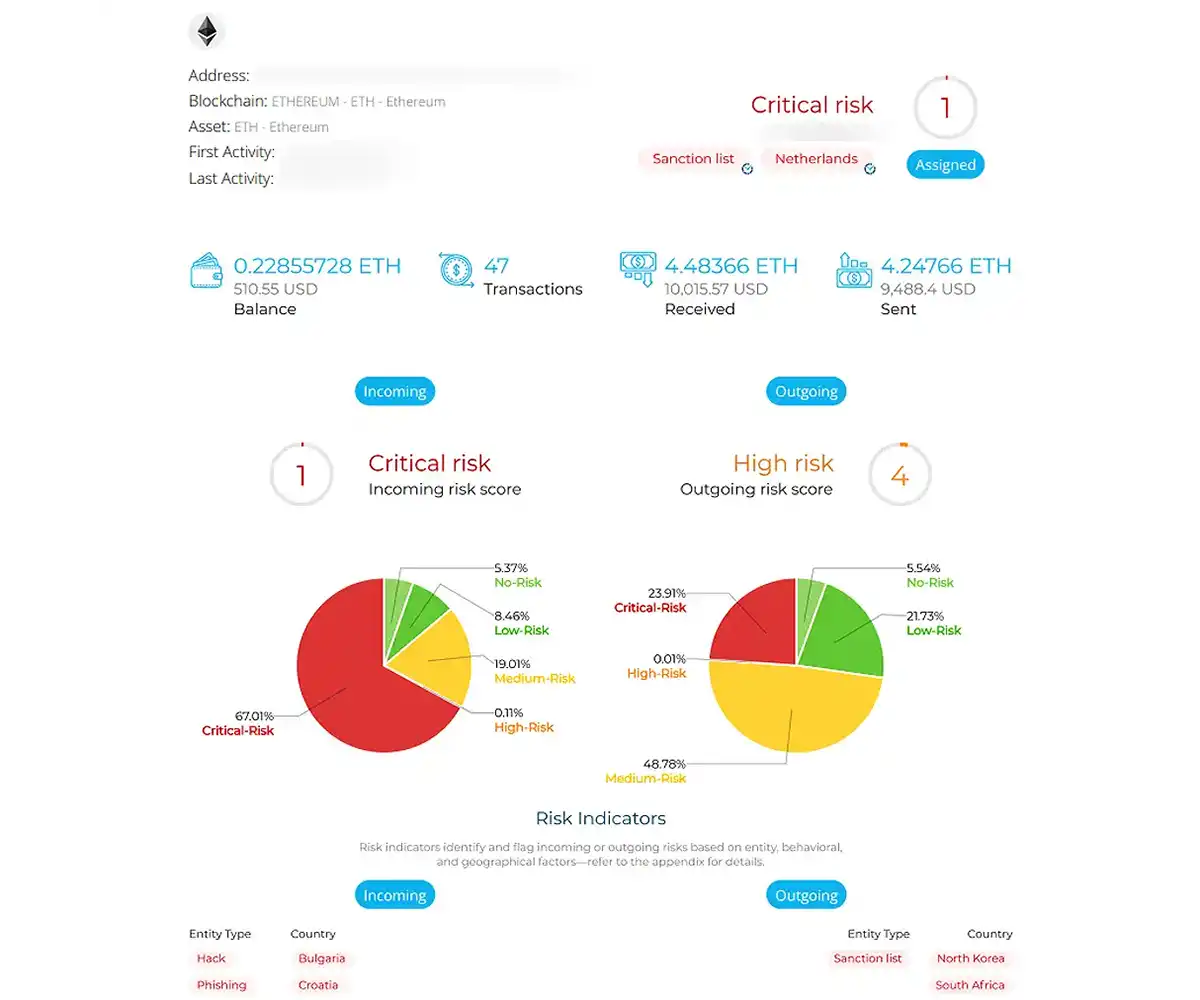
This approach shifts compliance from a reactive checklist to an active monitoring system. Instead of waiting for a flag to appear in a daily report, the graph highlights suspicious patterns as they form, allowing institutions to intervene before funds are fully integrated into the broader financial ecosystem.
Real-time vs batch screening
In high-stakes compliance, timing is the difference between stopping a crime and documenting it. Traditional batch screening processes transactions in periodic cycles, often creating a lag of minutes, hours, or even days. By the time a flagged transaction is reviewed, the illicit funds may have already moved through multiple wallets or mixed in liquidity pools. Real-time KYT graph analytics, by contrast, monitors activity as it happens on-chain.
This speed enables proactive blocking rather than reactive reporting. When a transaction is flagged in real time, compliance teams can intervene before settlement is final, potentially freezing assets or halting the flow entirely. Batch processing, while useful for historical audits and end-of-day reporting, lacks the immediacy required to prevent active illicit flows. The graph structure adds another layer of precision, visualizing connections between entities to identify complex laundering patterns that simple rule-based batch filters often miss.
The table below compares the operational impact of both approaches on key compliance metrics.
| Feature | Real-Time KYT | Batch Screening |
|---|---|---|
| Detection Lag | Seconds | Minutes to Days |
| Intervention Capability | Proactive blocking | Reactive reporting |
| Graph Context | Immediate path analysis | Retrospective mapping |
| Alert Volume | High signal-to-noise | High false positives |
For firms managing high-volume exchanges or institutional custody, the cost of delay is measured in regulatory fines and reputational damage. Real-time monitoring shifts the compliance model from catching bad actors after the fact to preventing them from entering the ecosystem in the first place.
Sanctions screening integration
KYT platforms integrate directly with OFAC (Office of Foreign Assets Control) and other global sanctions lists to block prohibited entities dynamically. This integration turns static watchlists into active, real-time filters. Instead of waiting for end-of-day batch processing, the system evaluates every transaction against the latest sanctions data the moment it hits the mempool or blockchain.
The graph analytics engine maps wallet addresses to known sanctioned entities. If a transaction involves a wallet linked to a sanctioned individual or entity, the system triggers an alert. This rapid detection enables proactive blocking, preventing the funds from moving further through the network. For compliance officers, this means immediate visibility into high-risk activity without manual ledger scanning.
Dynamic screening also handles indirect exposure. Graph analysis traces the path of funds to identify "mixers" or tumblers that might be used to obscure the origin of illicit assets. By visualizing these connections, KYT systems can flag transactions that appear clean on the surface but are part of a larger prohibited network. This depth of screening is essential for meeting the stringent requirements of modern financial regulations.
Monitoring active crypto assets
Compliance teams must also monitor the assets being transferred to understand their volatility and risk profile. The following chart provides real-time technical data for a major cryptocurrency, helping analysts assess the market impact of blocked or flagged transactions.
Market leaders in KYT tools
The KYT market is defined by a few dominant platforms that combine real-time graph analytics with deep compliance coverage. These providers serve as the technical backbone for exchanges, custodians, and financial institutions that must navigate an increasingly complex regulatory landscape. The primary differentiator among these leaders is not just the speed of detection, but the depth of their on-chain intelligence and the specificity of their alerting mechanisms.
Chainalysis
Chainalysis remains the industry standard for many large-scale institutions, offering a KYT solution that monitors activity in real time. Its strength lies in its ability to generate alerts within seconds of a transaction occurring on-chain, enabling proactive blocking of suspicious funds. The platform’s extensive labeling database allows compliance teams to trace the origin and destination of assets with high precision, making it a critical tool for meeting strict regulatory requirements.
SlowMist KYT
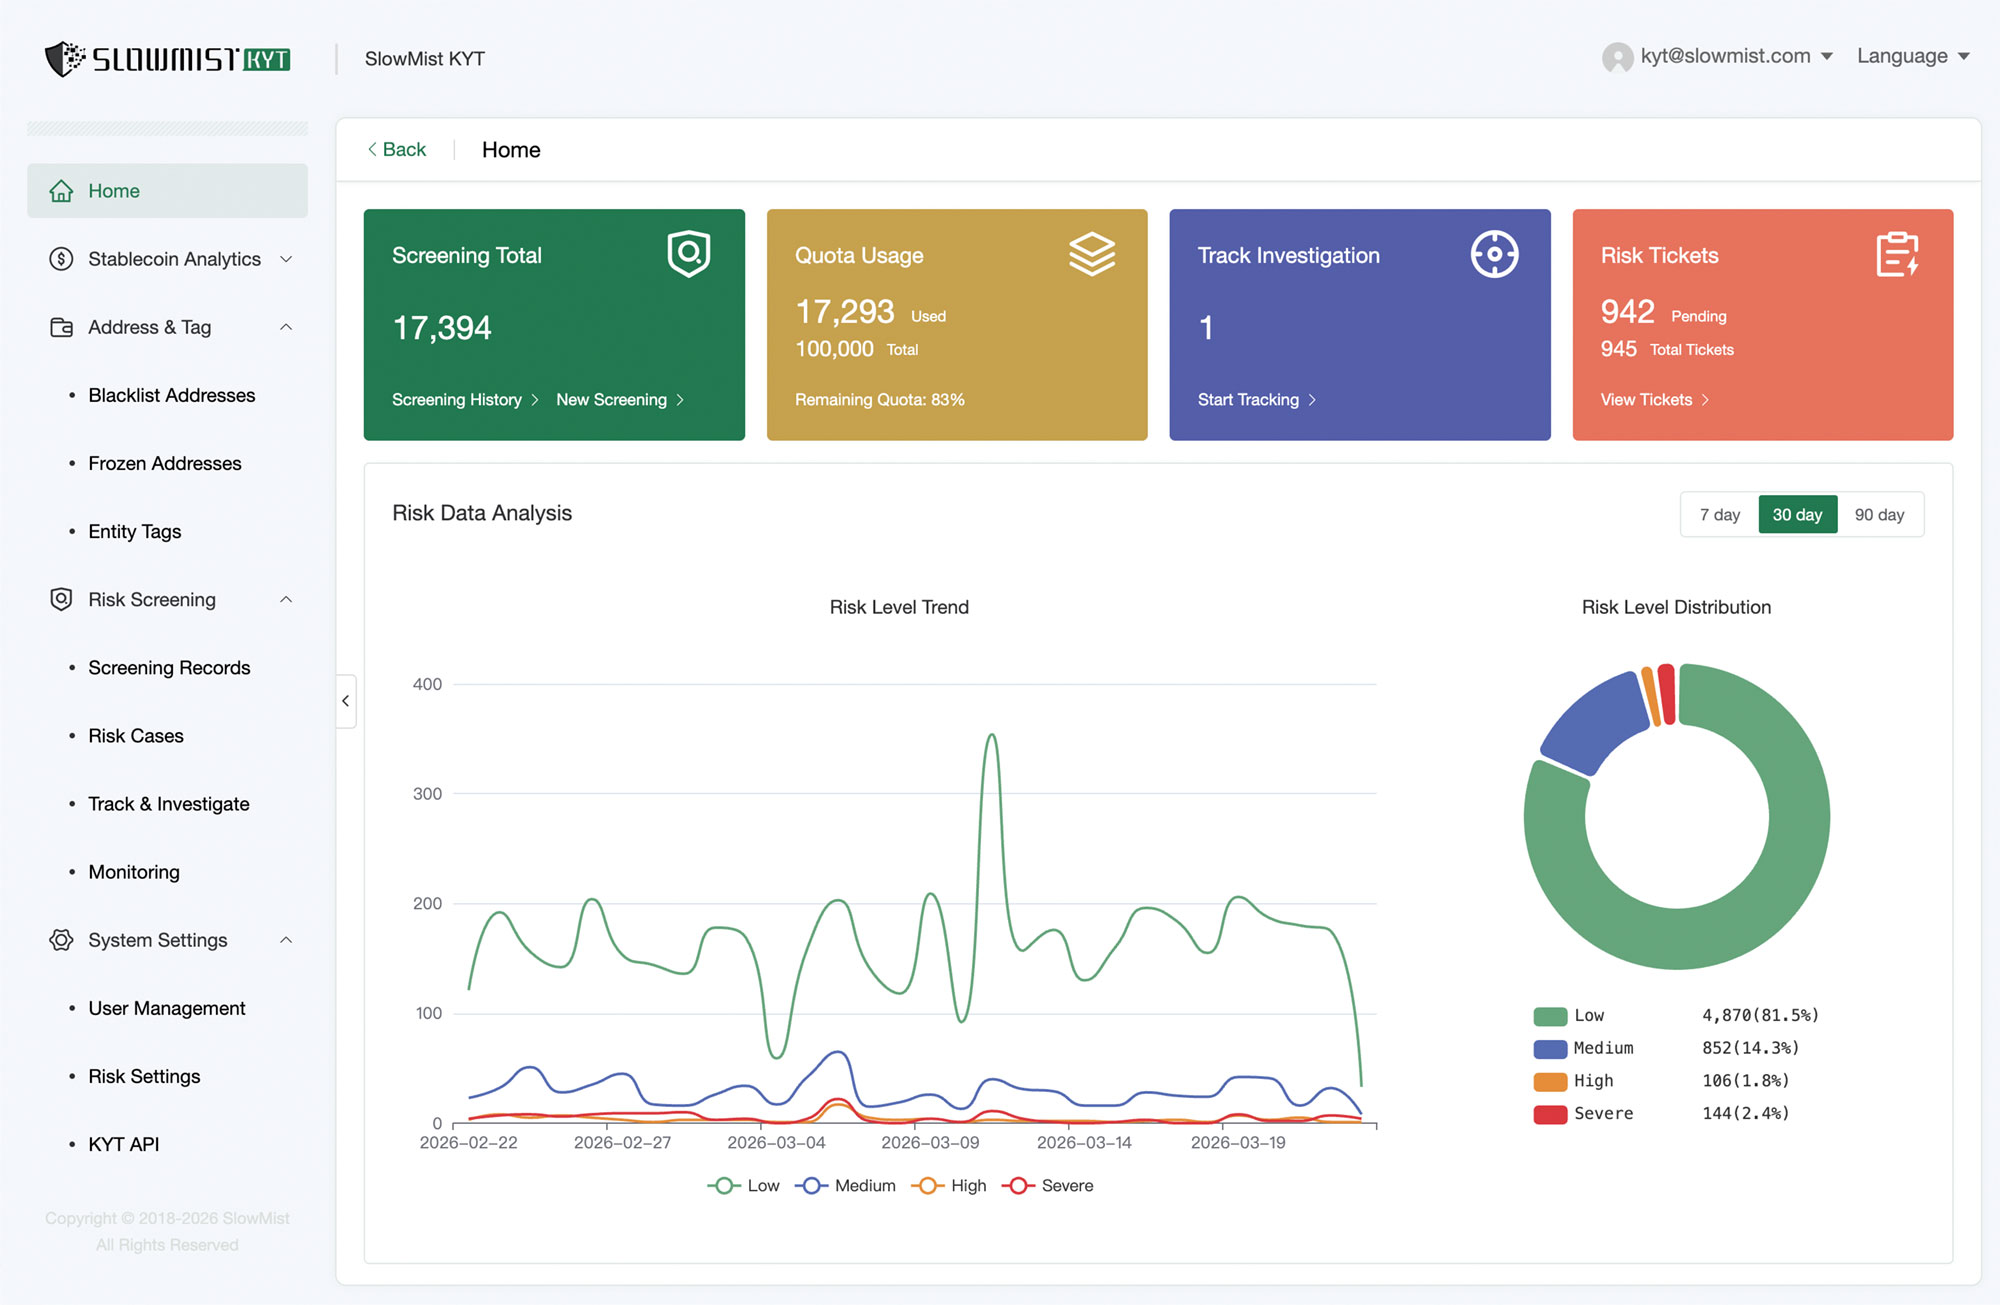
SlowMist KYT provides a professional, real-time, and configurable AML engine designed specifically for compliance teams at large institutions. As shown in the accompanying visual, the interface emphasizes clarity and configurability, allowing users to tailor monitoring rules to their specific risk profiles. The platform leverages graph analytics to identify complex money laundering patterns, offering a robust alternative for organizations that require a highly customizable detection framework.
Elliptic
Elliptic focuses on enterprise-grade compliance, integrating its KYT tools directly into the workflows of banks and financial services providers. The platform utilizes advanced graph analytics to map out the movement of illicit funds across the blockchain, providing actionable intelligence for investigations. Its emphasis on integration and scalability makes it a preferred choice for traditional financial institutions entering the crypto space.
Implementing KYT Graph Analytics
Integrating KYT graph analytics into your compliance stack requires a structured approach to ensure real-time detection capabilities are fully operational. This workflow aligns with industry standards for transaction monitoring and risk management.
Establish baseline risk scores for different wallet types and transaction volumes. Configure alerts for high-risk behaviors such as rapid fund movement or interactions with sanctioned entities. This step ensures the system flags only relevant anomalies.
Integrate your exchange or wallet infrastructure with the KYT provider’s API. Ensure that transaction data flows in real time to enable immediate analysis. Verify that the connection supports the required latency for your compliance SLAs.
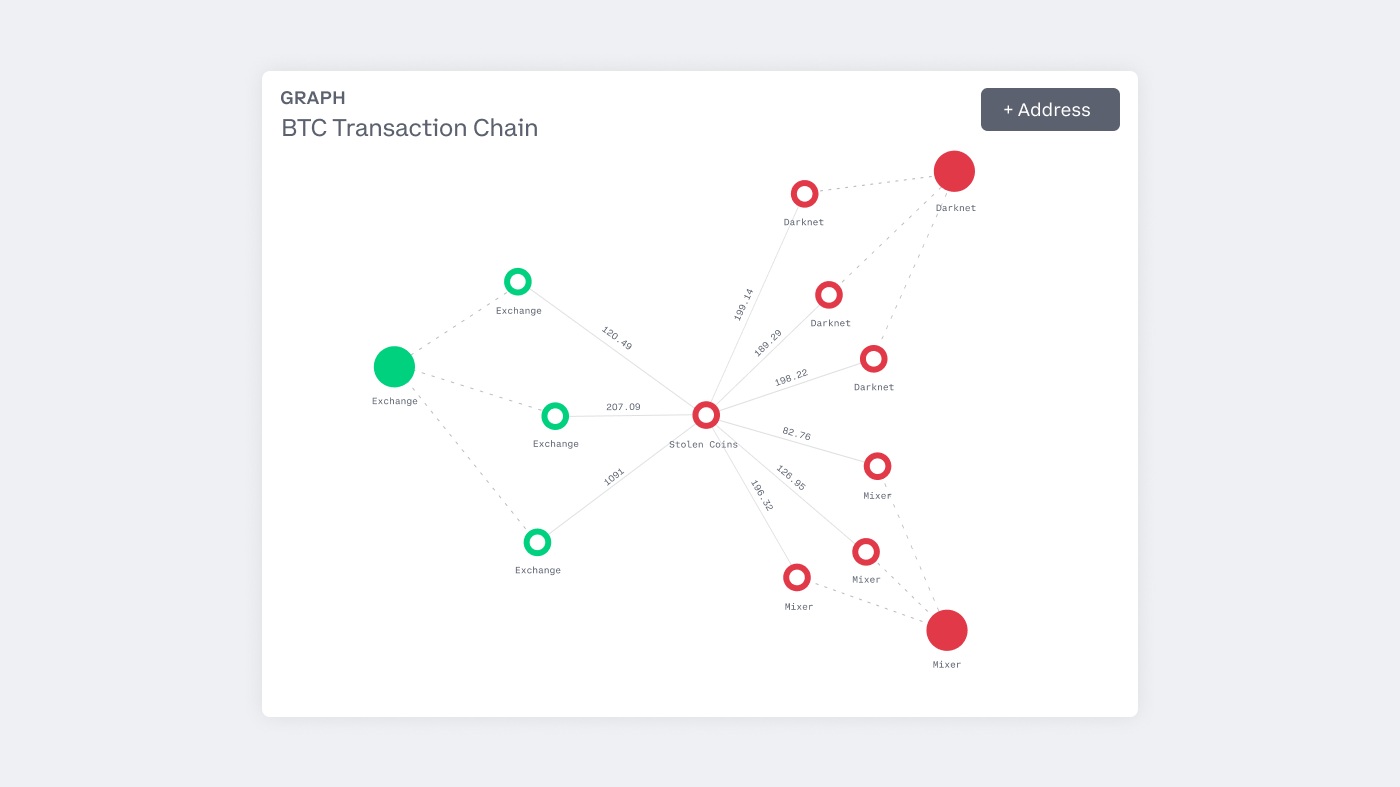
Set up dashboards that display transaction networks and entity relationships. Visualizing these connections helps analysts trace fund flows and identify hidden clusters of suspicious activity. This visual layer is critical for deep-dive investigations.
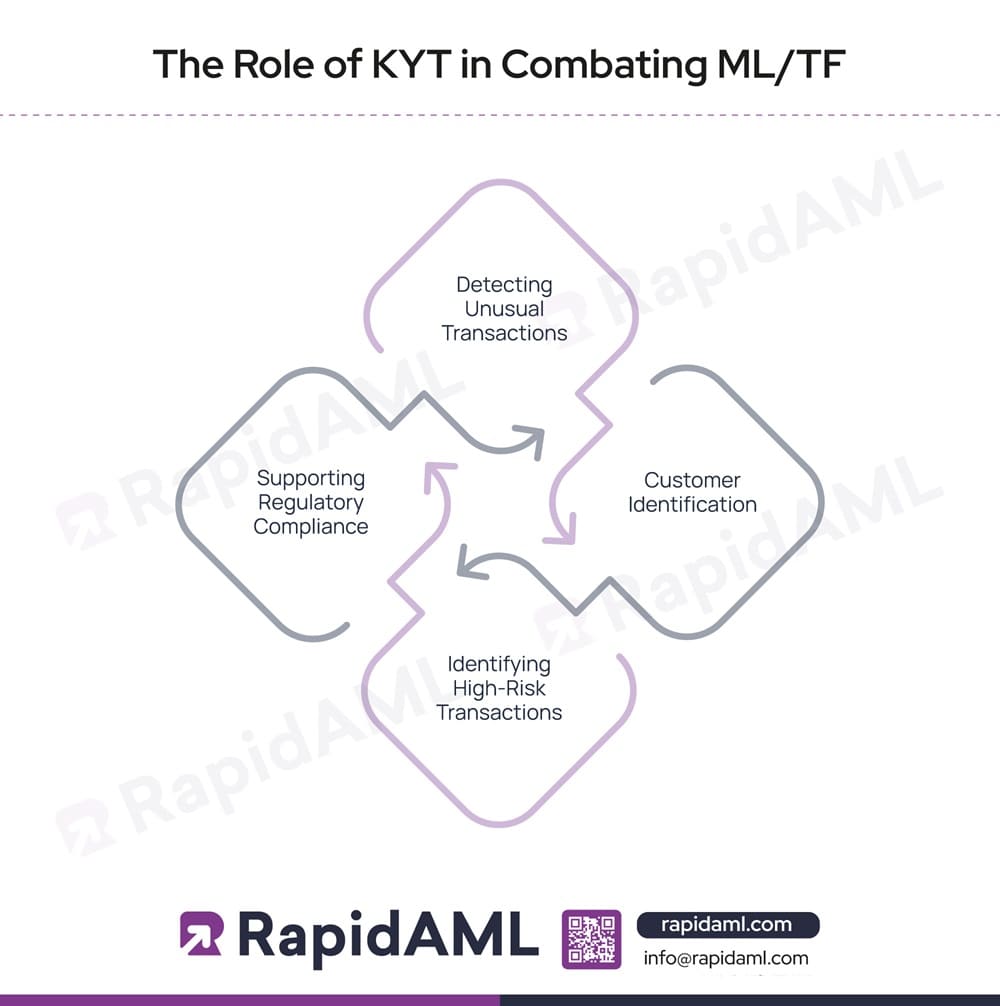
Run simulations using historical transaction data to validate alert accuracy. Follow this with a live pilot to monitor real-time performance. Adjust thresholds based on false positive rates to refine the detection logic before full deployment.
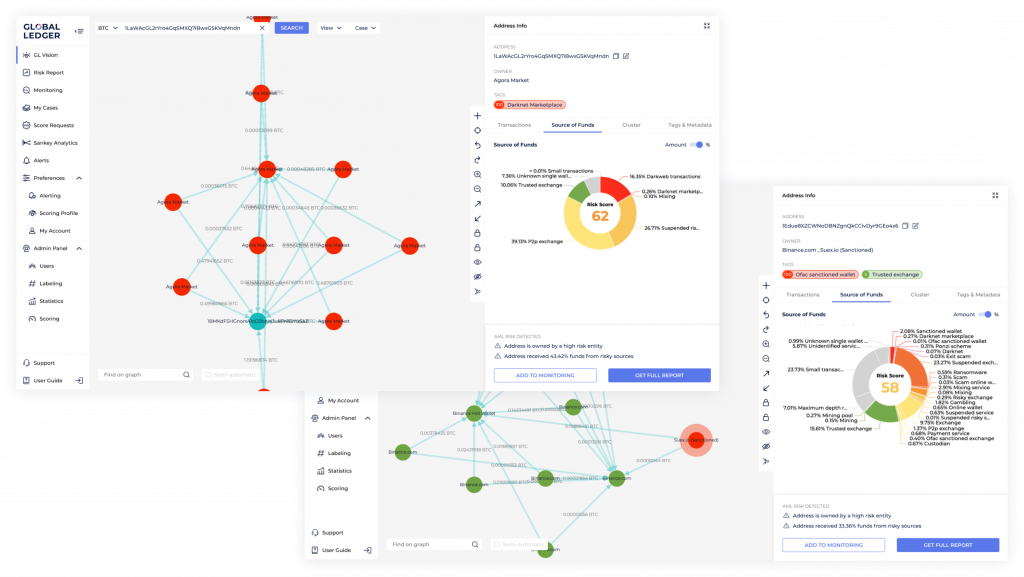
Schedule regular reviews of alert outcomes and system performance. Update risk models as new threats emerge and regulatory requirements evolve. Continuous monitoring ensures the KYT solution remains effective against evolving criminal tactics.
KYT vs. KYC: Identity versus Activity
Regulators and exchanges often group these two acronyms together, but they serve entirely different functions in a compliance stack. Know Your Customer (KYC) is the gatekeeper. It verifies who you are at the moment of account creation, relying on government IDs, biometric data, and address proofs. Once verified, the identity record sits in the database until it needs renewal.
Know Your Transaction (KYT) is the watchtower. It does not care about your name; it cares about the movement of funds. KYT solutions scan the blockchain in real time, flagging suspicious patterns, mixing services, or interactions with sanctioned addresses. As noted by Chainalysis, this system generates alerts within seconds of a transaction occurring, enabling proactive blocking before assets leave the platform.
Think of KYC as the passport control stamp and KYT as the security camera watching the terminal. You need both to satisfy global anti-money laundering (AML) requirements.
No comments yet. Be the first to share your thoughts!