
What KYC Graph Analytics Means
KYC graph analytics evaluates information organized as objects and their connections to understand how entities relate to one another. Unlike traditional row-based data processing, which treats each customer record as an isolated entry, this approach maps the network of relationships between people, accounts, and transactions. The goal is to uncover hidden links that standard databases often miss.
In a conventional system, a compliance officer might check a name against a sanctions list and stop there. Graph analytics goes further by tracing the web of interactions. It identifies shared addresses, common IP addresses, or indirect ownership structures that connect seemingly unrelated accounts. This shift from individual data points to network topology allows institutions to see the full picture of customer behavior.
This method supports perpetual KYC by continuously capturing new transactions, counterparties, and adverse media signals. Instead of static snapshots, the system reassesses risk in real time as the network evolves. By automating complex queries across these relationships, institutions can detect sophisticated fraud rings and money laundering patterns that would otherwise remain invisible.
Graph vs traditional KYC methods
Traditional KYC relies on isolated data points—names, addresses, and static ID verification. This siloed approach treats each customer as an independent entity, requiring manual cross-referencing to spot potential links. While effective for basic identity confirmation, it struggles to detect sophisticated financial crime networks that operate through layered, indirect relationships.
Graph analytics shifts this paradigm by mapping relationships. Instead of viewing a customer in isolation, graph technology connects entities through transactions, shared addresses, and common associates. This network view reveals hidden structures, such as circular trading or shell company chains, that traditional databases miss. As noted by TigerGraph, this enables "perpetual KYC," where risk is continuously reassessed as new transactional edges form in real time [src-serp-2].
The following comparison highlights the operational differences between these two approaches:
| Dimension | Traditional KYC | Graph Analytics |
|---|---|---|
| Data Structure | Relational tables, siloed records | Nodes and edges, interconnected network |
| Detection Speed | Batch processing, delayed insights | Real-time, immediate pattern recognition |
| Relationship Visibility | Direct links only, manual investigation needed | Multi-hop connections, hidden network paths |
| Regulatory Adaptability | Static rules, frequent manual updates | Dynamic rule application, automated risk scoring |
This structural difference fundamentally changes how institutions handle compliance. Traditional methods are reactive, often identifying risks only after suspicious activity has occurred. Graph-based systems are proactive, flagging anomalies as they emerge within the broader network context. This shift is critical for meeting modern regulatory expectations, which increasingly demand not just identity verification, but ongoing monitoring of complex financial behaviors [src-serp-1].
Detecting hidden fraud networks
Traditional rule-based systems often miss the subtle connections between bad actors because they look at transactions in isolation. KYC graph analytics changes this by mapping relationships between entities—people, accounts, devices, and merchants—into a single, interconnected network. This approach reveals complex patterns that standard databases cannot see.
Uncovering mule networks and collusive rings
Fraudsters rarely act alone. They build structured networks to launder money or manipulate markets. Graph databases identify these structures by tracing links across thousands of data points in real time. For example, a mule network might look like dozens of unrelated accounts receiving funds from a single source, all linked by shared device fingerprints or IP addresses. Graph analytics flags these clusters instantly, whereas traditional methods might only catch the final transaction after the money has moved.
Similarly, collusive merchants can manipulate review systems or process fraudulent payments through shell companies. By visualizing these connections, compliance teams can spot the "hub-and-spoke" patterns typical of organized fraud rings. Tools like Linkurious emphasize that graph technology allows this analysis through a single query, automating what used to be a manual, error-prone process of cross-referencing spreadsheets.
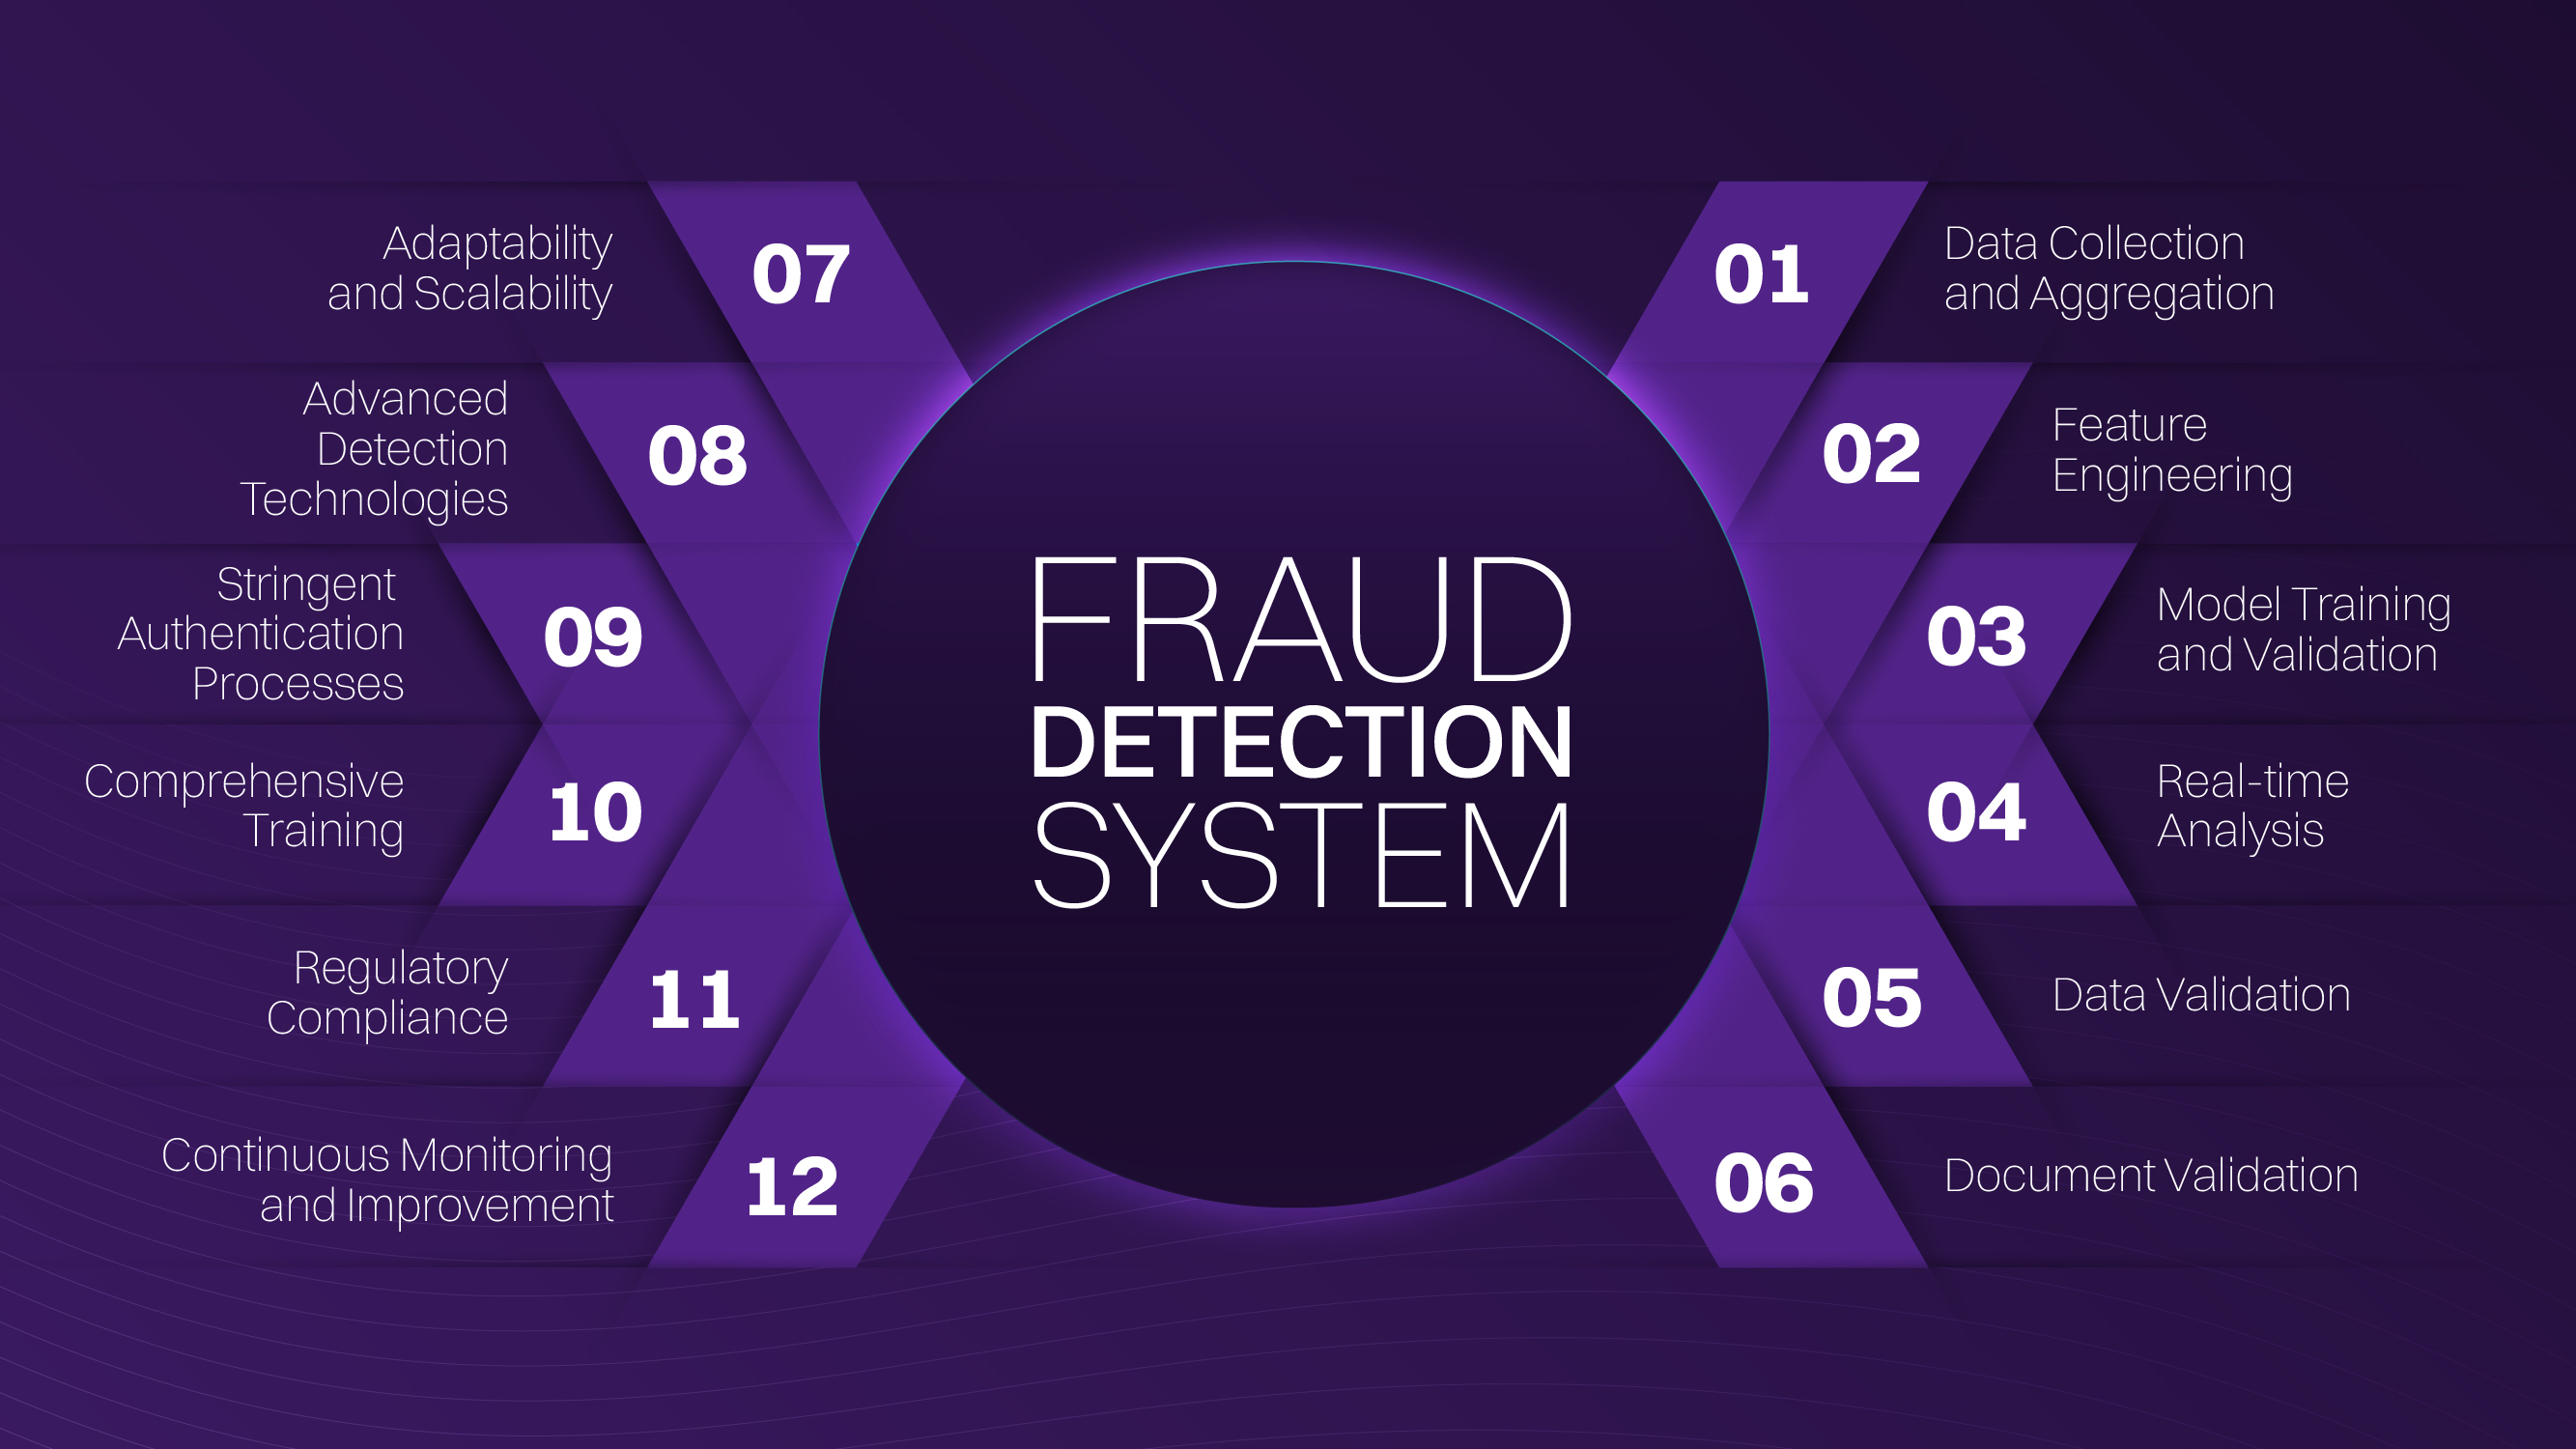
Why visual insights matter
The power of graph analytics lies in its ability to show, not just tell. When a system highlights a suspicious cluster, it provides a visual map of how entities are connected. This visual context helps investigators understand the scope of a potential fraud ring quickly. Instead of sifting through rows of transaction logs, they see the network topology—identifying the central nodes that drive the activity and the peripheral accounts that act as conduits.
This method is particularly effective against sophisticated threats. As noted by industry experts at Signzy, graph models are essential for uncovering mule networks and hidden fraud rings that traditional methods miss. By strengthening AML cases with these visual network insights, organizations can move from reactive monitoring to proactive detection, stopping fraud before it scales.
Perpetual KYC and real-time updates
Use this section to make the KYC Graph Analytics decision easier to compare in real life, not just on paper. Start with the reader's actual constraint, then separate must-have requirements from details that are merely nice to have. A practical choice should survive normal use, maintenance, timing, and budget. If a recommendation only works in an ideal situation, call that out plainly and give the reader a fallback path.
-
Verify the basicsConfirm the core specs, condition, and fit before comparing extras.
-
Price the downsideLook for the repair, maintenance, or replacement cost that would change the decision.
-
Compare alternativesCheck at least two comparable options before treating one listing as the benchmark.
Choosing a graph database for compliance
Selecting the right graph database for KYC graph analytics requires balancing raw query speed with the ability to handle massive, evolving datasets. AML practitioners emphasize that graph databases are ideal for this task because they model the complex cash flow relationships inherent in money laundering more naturally than traditional relational tables [[src-serp-5]].
Query Performance and Scalability
The primary advantage of a graph database is its ability to traverse relationships in constant time, regardless of dataset size. For KYC compliance, this means you can uncover multi-layered hidden connections between beneficial owners, shell companies, and high-risk entities in real-time. As data volumes grow, the database must scale horizontally without degrading the speed of these deep-dive queries.
Integration and Ecosystem Fit
Your chosen solution must integrate seamlessly with existing compliance workflows. Look for databases that offer robust APIs and connectors for common data pipelines. The technology should support the storage of both structured customer data and unstructured network graphs, allowing your analytics team to switch between transaction monitoring and relationship mapping without friction [[src-serp-6]].
Decision Criteria
Prioritize databases with proven track records in financial services. Verify that the vendor provides clear documentation on data governance, audit trails, and regulatory compliance features. The goal is to reduce the time from data ingestion to actionable insight, ensuring your KYC processes remain efficient as regulatory scrutiny intensifies.
Common questions about KYC analytics
What is a KYC data analyst?
A KYC data analyst enforces compliance with laws and regulations governing financial and securities institutions. Their primary role involves examining, verifying, and authenticating records to ensure that financial and real estate transactions meet legal standards. They act as the human layer that interprets complex data sets to confirm customer identities and assess risk profiles.
What is graph analytics in this context?
Graph analytics evaluates information organized as objects and their connections. The purpose is to understand how these objects relate or could relate to one another. In KYC workflows, this means mapping relationships between entities—such as individuals, companies, and bank accounts—to uncover hidden networks that traditional database queries might miss.
How does graph analytics support ongoing KYC?
Graph technology supports perpetual KYC by continuously capturing new transactions, counterparties, and adverse media signals. This allows institutions to perform real-time risk reassessment rather than relying on static, periodic reviews. As new data enters the system, the graph updates relationships instantly, enabling faster detection of emerging fraud patterns.
Why is real-time detection important for fraud prevention?
Real-time detection is critical because fraud networks evolve quickly. By leveraging graph analytics, institutions can identify suspicious connections as they happen, rather than after the fact. This proactive approach reduces financial loss and helps maintain regulatory compliance by ensuring that risk assessments are always current and based on the latest available data.
No comments yet. Be the first to share your thoughts!