KYT Graph defined for 2026
In the landscape of blockchain analytics, "KYT Graph" refers to Know Your Transaction graph analysis, a specialized methodology for tracing fund flows across distributed ledgers. This technology maps the connectivity between wallet addresses to identify patterns of suspicious activity, such as money laundering, terrorist financing, or sanctions evasion. By visualizing these complex transactional relationships, compliance officers can move beyond simple address screening to understand the context of financial movements.
It is critical to distinguish this regulatory technology from the consumer brand KYT, which manufactures motorcycle helmets. Search results for "KYT Graph" often surface product pages for R2R or TT-Revo helmets, creating significant ambiguity for researchers and legal professionals. This article exclusively addresses the KYT Graph technology used for anti-money laundering (AML) and regulatory compliance in decentralized finance (DeFi), not the protective gear industry.
The core function of KYT Graph analytics lies in its ability to de-anonymize blockchain transactions. While public ledgers like Bitcoin and Ethereum are transparent, the entities behind wallet addresses remain pseudonymous. Graph analytics algorithms cluster addresses based on shared transaction histories, common input ownership, and behavioral patterns. This clustering allows compliance teams to assign risk scores to entire networks of addresses rather than isolated wallets, providing a more accurate assessment of potential regulatory violations.
As DeFi protocols continue to evolve in 2026, the integration of graph analytics into compliance workflows has become essential. Regulatory bodies, including the Financial Action Task Force (FATF), emphasize the need for virtual asset service providers (VASPs) to implement robust transaction monitoring. KYT Graph tools enable these entities to satisfy the "Travel Rule" requirements and maintain audit trails that satisfy both domestic and international regulatory standards.
The technology relies on sophisticated data structures to handle the scale of blockchain data. Unlike traditional financial systems where entities are clearly identified, blockchain networks require probabilistic matching and heuristic analysis to link addresses to real-world identities. These graphs are continuously updated as new transactions occur, ensuring that compliance teams have access to the most current risk intelligence. This dynamic nature is what distinguishes graph analytics from static blacklist screening, offering a proactive approach to regulatory compliance.
Real-time monitoring mechanics
Understanding how a KYT graph processes transaction data requires distinguishing between the proprietary technology platform and the general concept of Know Your Transaction. In the context of DeFi compliance, the system operates as a continuous surveillance layer rather than a static database. It ingests blockchain data streams, maps address relationships, and cross-references them against regulatory sanctions lists in milliseconds.
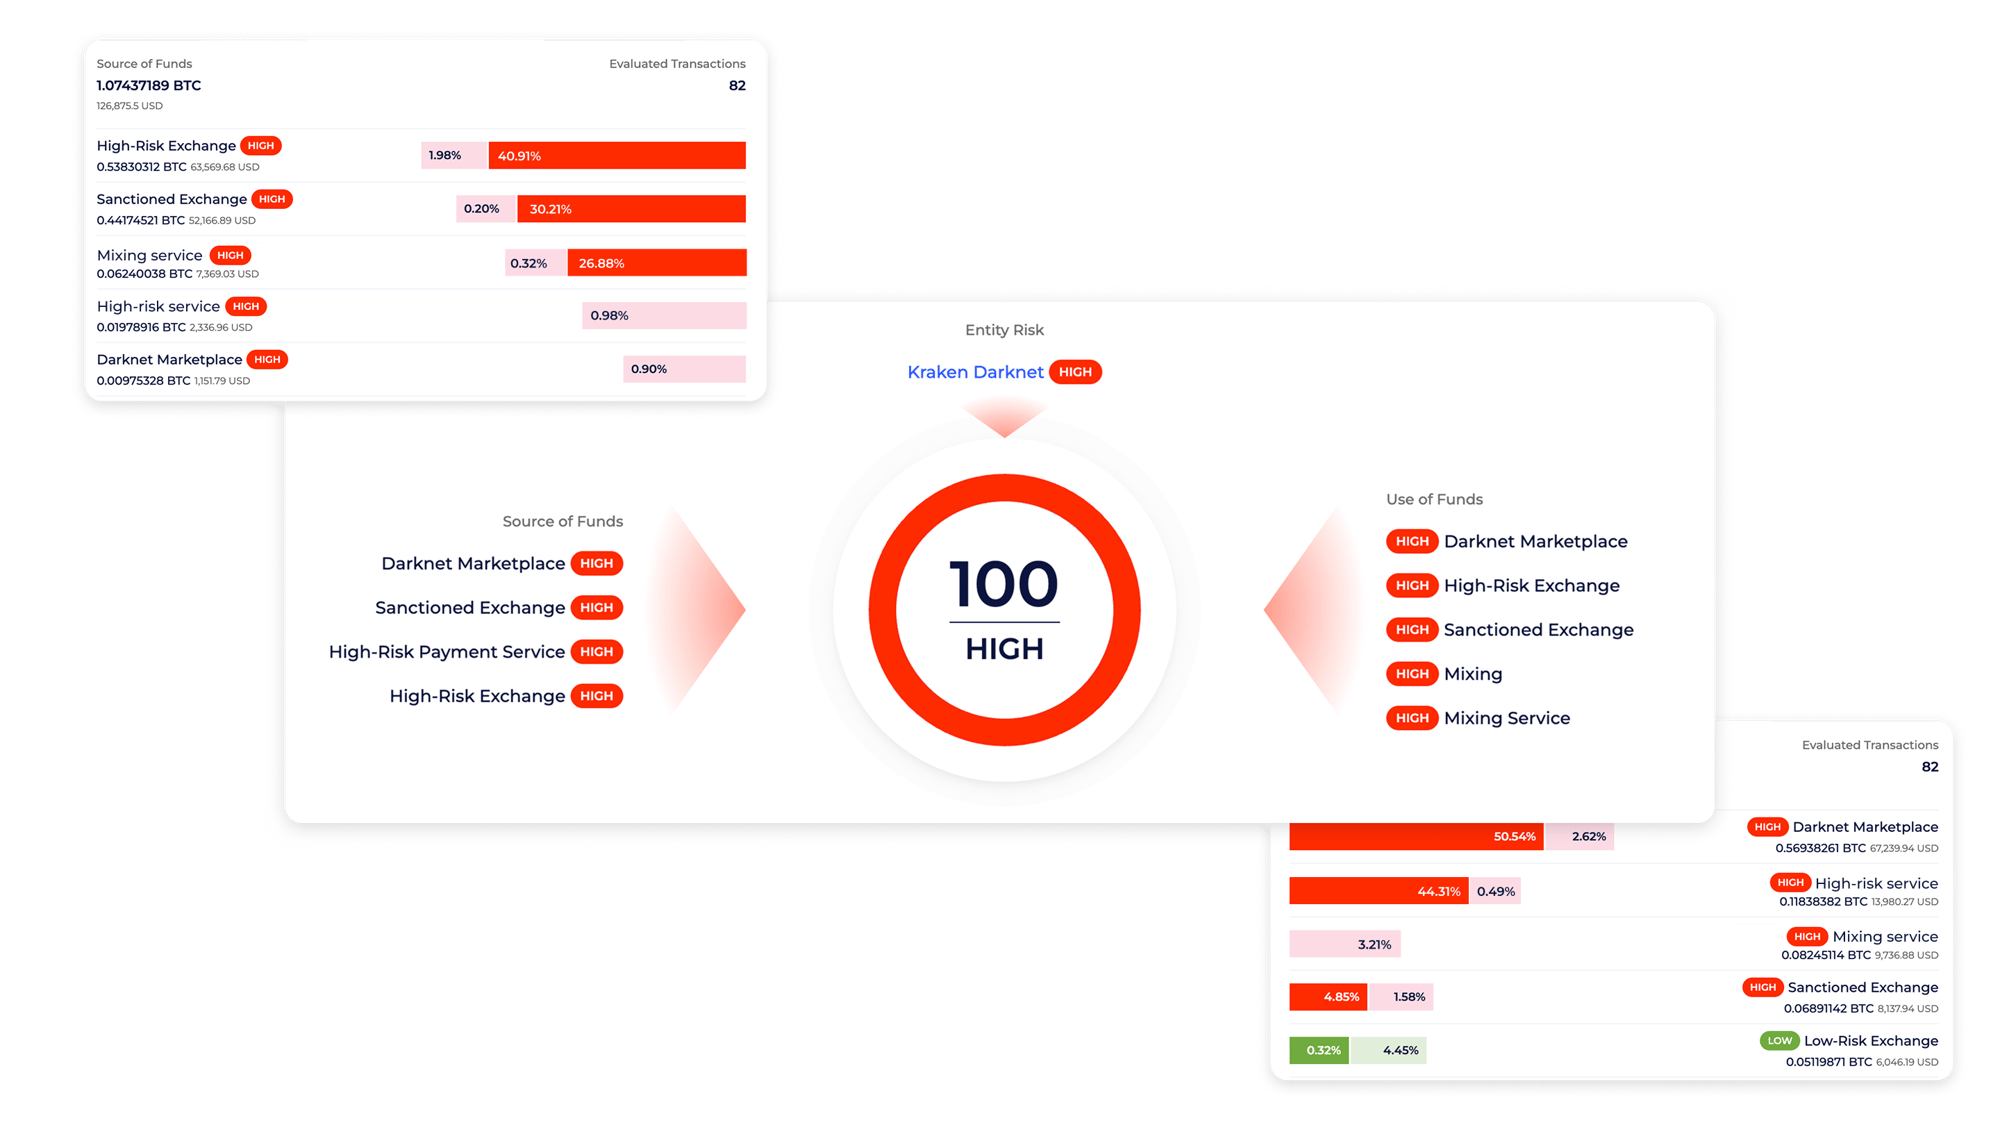
The process begins with transaction ingestion. As a transfer occurs on-chain, the graph captures the sender, receiver, and intermediary addresses. This data is immediately normalized to remove noise and identify the true economic actors. The system then performs a rapid graph traversal, tracing the flow of funds through multiple hops to uncover hidden connections or mixing services designed to obscure origin.
The system captures raw blockchain data and normalizes address labels. This step ensures that all incoming transactions are parsed into a consistent format, stripping away unnecessary metadata while preserving the critical path of fund movement.
Using directed graph algorithms, the system traces transactions backward and forward. It identifies clusters of addresses that share common funding sources or beneficiaries, revealing the underlying structure of the transaction beyond the immediate sender and receiver.
The traversed paths are compared against real-time updates from regulatory bodies, including OFAC, the EU, and UN sanctions lists. If any address in the cluster matches a sanctioned entity, the transaction is flagged for immediate review.
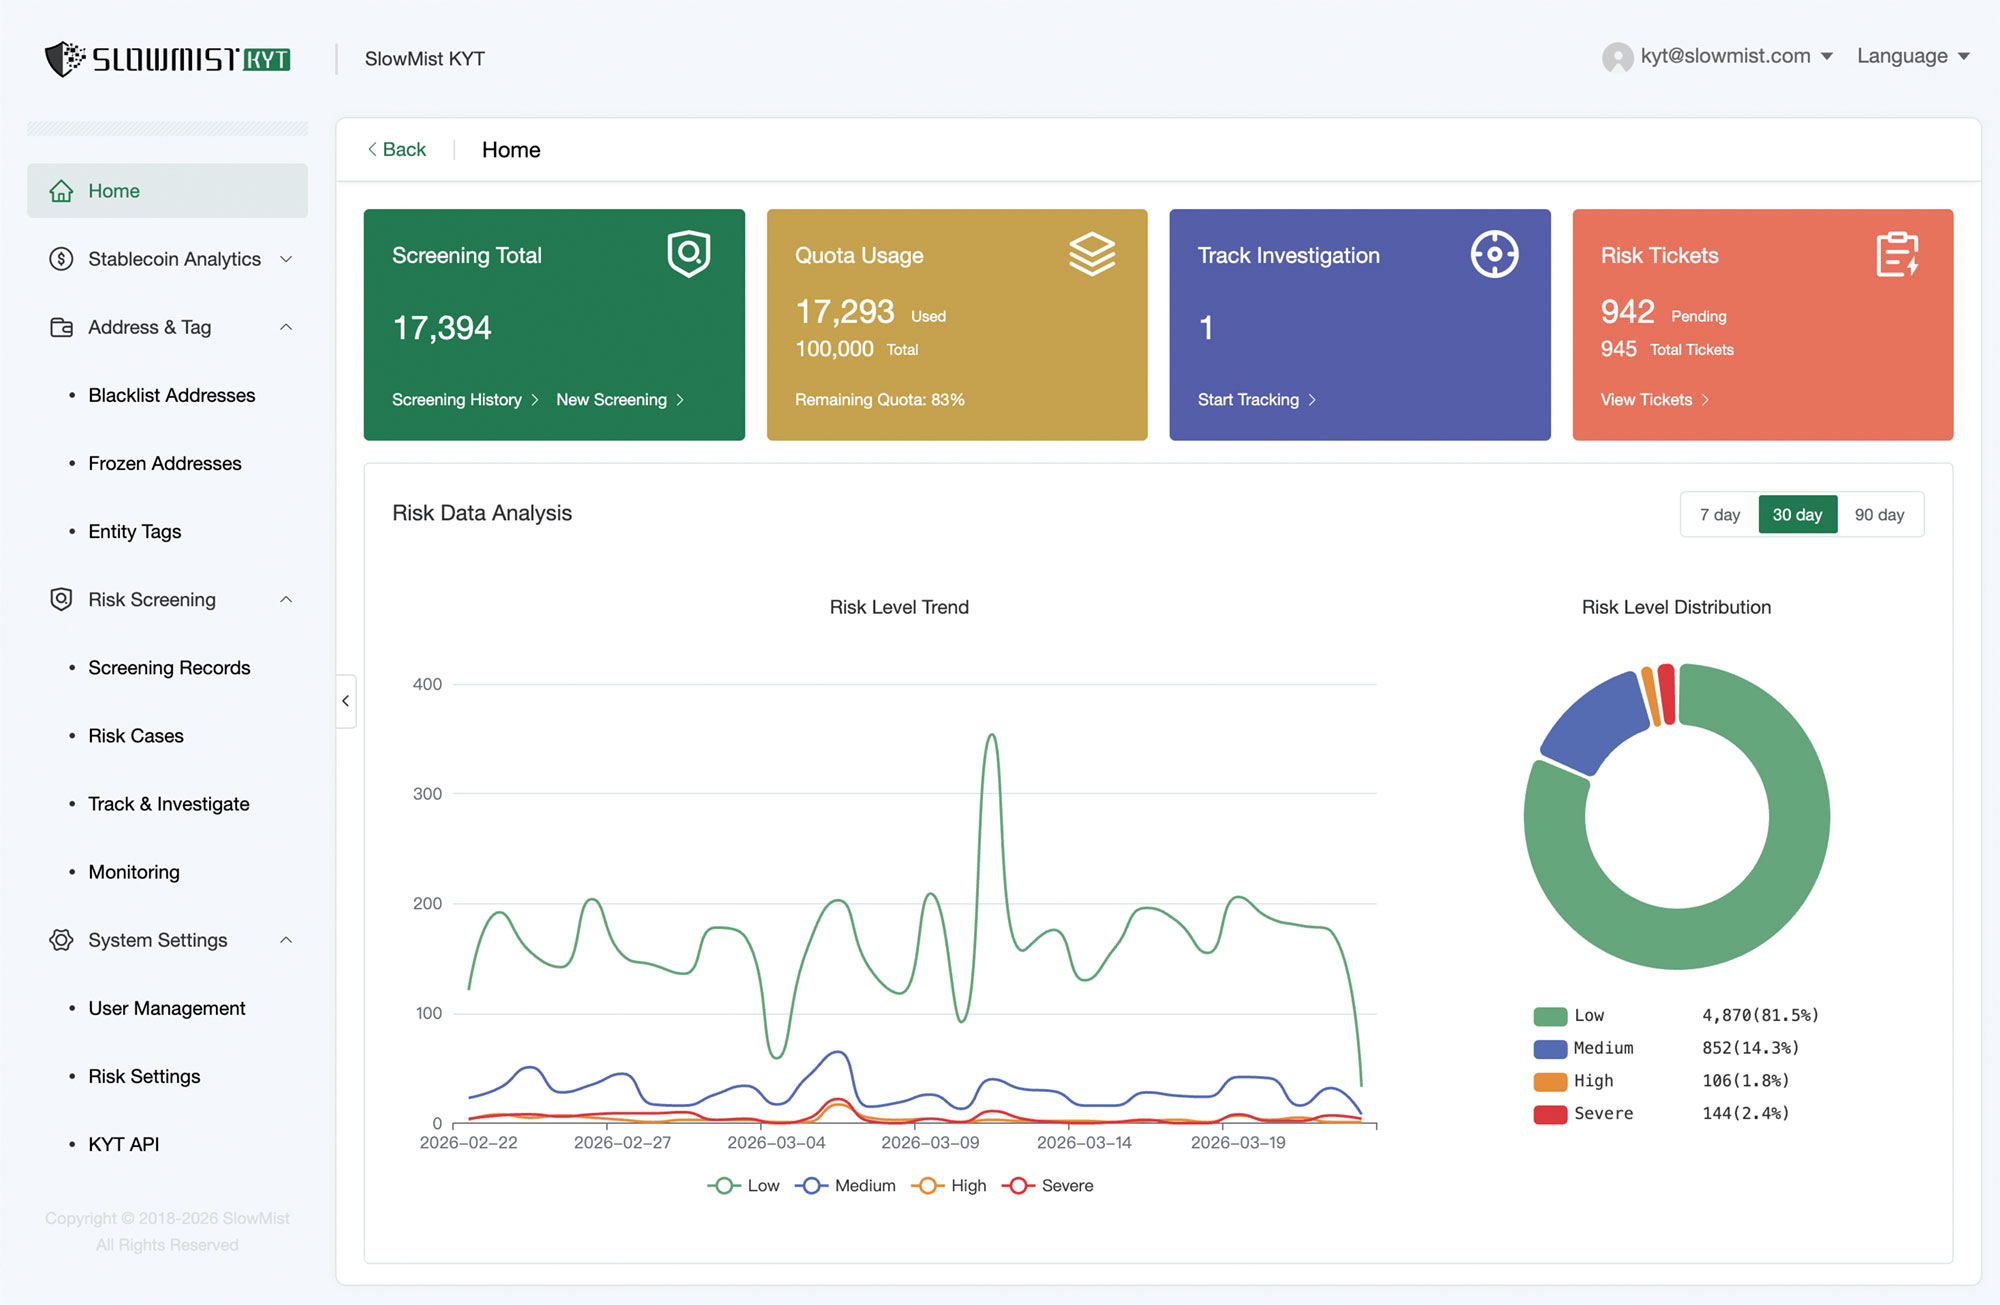
High-risk transactions generate an alert with a risk score and a visual map of the involved entities. This output is integrated into compliance dashboards, allowing analysts to make informed decisions without manually tracing the blockchain.
This real-time capability is essential for DeFi protocols that must comply with evolving regulations such as the EU’s Markets in Crypto-Assets (MiCA) regulation, which entered into force in 2024. By automating the detection of high-risk addresses, platforms can maintain compliance without sacrificing the speed and transparency that define decentralized finance.
DeFi compliance obligations
The regulatory environment for decentralized finance has shifted from advisory guidance to enforceable mandates. For protocols and service providers integrating KYT (Know Your Transaction) graph analytics, the primary driver is the need to satisfy Anti-Money Laundering (AML) and Counter-Terrorist Financing (CTF) obligations. Unlike traditional finance, where intermediaries hold customer data, DeFi protocols often lack a centralized entity to assume liability. Consequently, the burden of compliance has moved to the edges of the network—specifically to wallet providers, decentralized exchanges (DEXs), and liquidity pool operators who interface with fiat on-ramps and off-ramps.
OFAC Sanctions and Asset Blocking
The Office of Foreign Assets Control (OFAC) enforces economic and trade sanctions based on foreign policy and national security goals. In the DeFi context, OFAC compliance requires the screening of transactions against the Specially Designated Nationals (SDN) list. This is not merely a recommendation; it is a legal requirement for any entity subject to U.S. jurisdiction, including many centralized exchanges and increasingly, decentralized infrastructure providers.
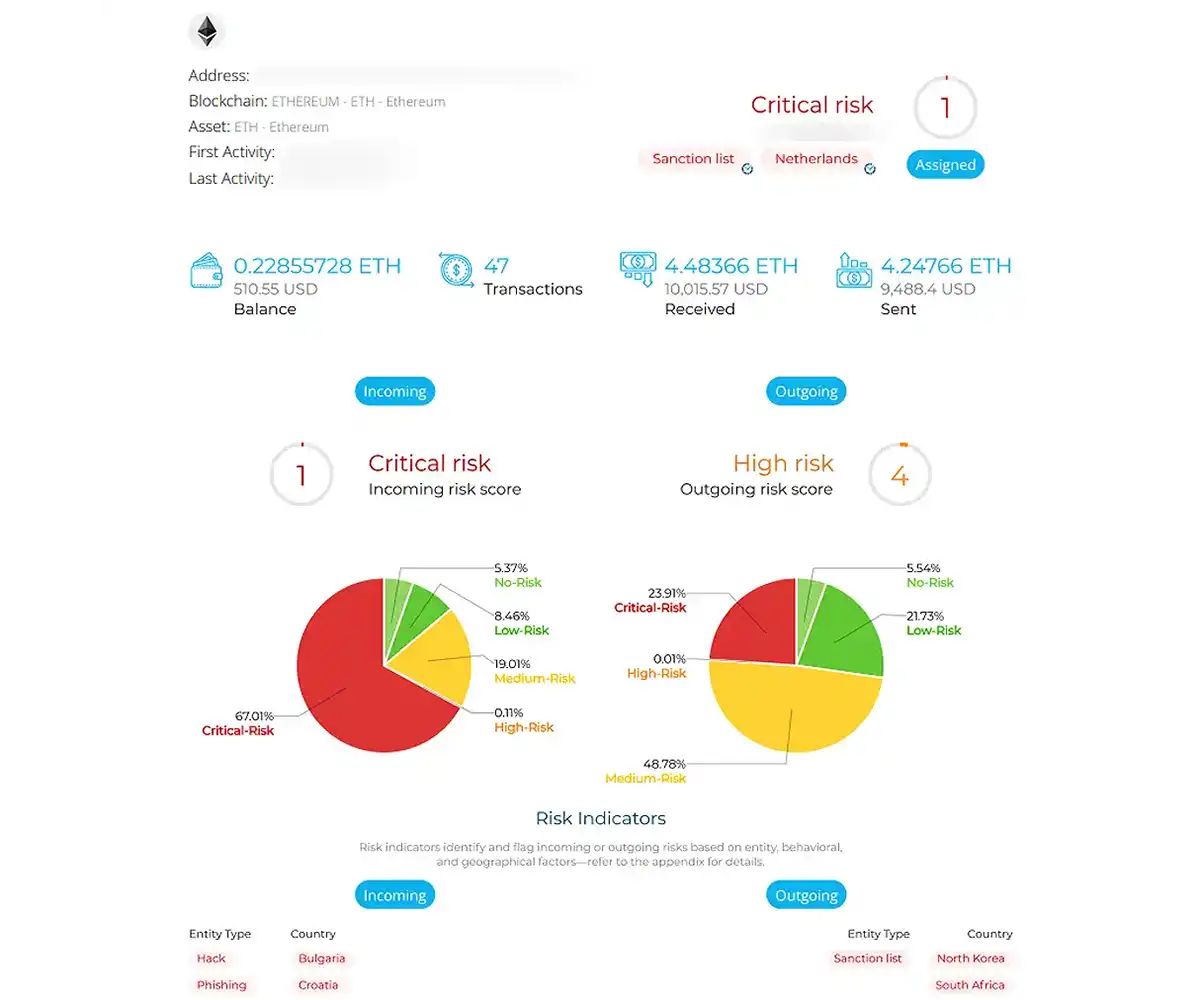
KYT graph analytics enables protocols to trace the origin and destination of funds in real-time. By mapping transaction histories across blockchain networks, these tools can identify interactions with sanctioned addresses, even if the funds have passed through multiple mixers or privacy-enhancing protocols. Failure to block transactions involving SDN-listed addresses can result in severe penalties, including fines and loss of access to the U.S. financial system.
FATF Travel Rule and VASP Requirements
The Financial Action Task Force (FATF) has established guidelines that apply to Virtual Asset Service Providers (VASPs). The "Travel Rule" requires VASPs to collect and transmit specific information about the originator and beneficiary of virtual asset transfers. While the rule traditionally applies to fiat-crypto conversions, its scope is expanding to include peer-to-peer crypto transfers between VASPs.
KYT graph analytics helps VASPs comply with these requirements by providing context to transactions. It allows platforms to verify the identity of counterparties by linking wallet addresses to known entities. This is critical for maintaining an audit trail that satisfies regulatory inquiries. Without such tools, VASPs risk facilitating anonymous transfers that evade detection, exposing themselves to regulatory scrutiny.
AML Directives and Risk-Based Approaches
The European Union’s Markets in Crypto-Assets (MiCA) regulation and other regional AML directives require crypto-asset service providers to implement robust risk-based approaches to AML/CTF. This includes customer due diligence (CDD), ongoing monitoring of transactions, and reporting of suspicious activities.
KYT graph analytics supports these obligations by providing continuous monitoring capabilities. It allows protocols to detect unusual patterns, such as rapid movement of funds through multiple addresses or interactions with high-risk jurisdictions. By integrating these analytics, protocols can automate the identification of suspicious activities, reducing the manual burden on compliance teams and improving the accuracy of reporting.
Key Compliance Checkpoints
To ensure adherence to these regulatory frameworks, DeFi protocols should consider the following checkpoints:
- Sanctions Screening: Implement real-time screening of all incoming and outgoing transactions against OFAC SDN lists and other relevant sanctions databases.
- Transaction Monitoring: Deploy KYT graph analytics to monitor transaction patterns for signs of money laundering, terrorist financing, or other illicit activities.
- Travel Rule Compliance: Ensure that all transfers between VASPs include the required originator and beneficiary information, as per FATF guidelines.
- Risk Assessment: Conduct regular risk assessments to identify and mitigate vulnerabilities in the protocol’s AML/CTF framework.
- Audit Trails: Maintain detailed records of all transactions and compliance actions to facilitate regulatory audits and investigations.
These obligations are not static. As regulatory bodies continue to refine their guidance, protocols must remain agile, updating their compliance strategies to address emerging risks and requirements. The integration of KYT graph analytics is not just a technical upgrade; it is a strategic necessity for long-term viability in the DeFi ecosystem.
Sanctions screening accuracy
The primary challenge in modern compliance is not just identifying illicit activity, but distinguishing it from legitimate commerce. Traditional rule-based systems often flag high volumes of transactions that are actually benign, creating a backlog that strains resources and delays customer onboarding. This is where graph-based analysis of transaction clusters offers a distinct advantage over linear screening methods.
Graph technology maps relationships between entities—wallets, exchanges, and smart contracts—rather than treating each transaction as an isolated event. By visualizing these connections, compliance teams can see the context behind a transfer. A single transaction might look suspicious in isolation, but when viewed as part of a broader network, it may reveal a clear, compliant pattern of activity. This reduces the noise, allowing analysts to focus on genuine risks.
The difference in accuracy between these approaches is significant. The table below compares key performance metrics for traditional linear screening versus graph-based cluster analysis in DeFi contexts.
| Metric | Traditional Linear Screening | Graph-Based Cluster Analysis |
|---|---|---|
| False Positive Rate | High (20-40%) | Low (5-10%) |
| Investigation Time | Hours per alert | Minutes per cluster |
| Context Visibility | Single transaction view | Full network topology |
| Adaptability to New Tactics | Static rule updates | Dynamic pattern recognition |
Reducing false positives is not merely an efficiency gain; it is a regulatory necessity. Regulators in the EU and US are increasingly scrutinizing compliance programs for "alert fatigue," where genuine risks are missed because teams are overwhelmed by false alarms. Graph analytics provides the depth needed to substantiate due diligence, offering a clearer audit trail that demonstrates how decisions were made.
This shift from volume-based filtering to relationship-based analysis allows institutions to maintain strict adherence to sanctions lists while keeping the user experience smooth. It turns compliance from a bottleneck into a transparent, verifiable layer of the financial infrastructure.
No comments yet. Be the first to share your thoughts!