
Why graph analytics matters for KYT
The traditional model of KYT has relied on address-level screening, a static approach that treats every wallet as an isolated entity. This method checks a deposit or withdrawal against a blacklist of known bad actors. It works for simple, direct transfers. It fails when funds move through a network of intermediaries. In high-stakes compliance, this gap is no longer acceptable. Regulators and financial institutions now require visibility into the relationships between addresses, not just the addresses themselves.
Graph analytics shifts the focus from individual points to the connections between them. By mapping transactions as edges and wallets as nodes, compliance teams can trace the flow of assets across multiple hops. This reveals hidden links to sanctioned entities that simple address screening misses. A transaction may originate from a clean wallet, but if that wallet has previously interacted with a mixer or a sanctioned exchange, the risk profile changes entirely. Graph analysis exposes these indirect associations, providing a holistic view of the transaction's origin.
The PNNL defines graph analytics as the use of graph structures to model and understand the strength and direction of relationships between entities in a network. This capability is critical for detecting complex laundering schemes. Criminals often use layering techniques to obscure the source of funds. Graph algorithms can identify these patterns by analyzing centrality, degree, and path traversal. This allows compliance teams to flag suspicious activity before it settles, rather than reacting after the fact.
Adopting graph-based KYT tools is becoming the new standard for institutions handling high-value assets. The ability to visualize and query these relationships in real-time transforms compliance from a reactive checklist into a proactive defense. As regulatory scrutiny intensifies, the depth of insight provided by graph structures will determine which firms can operate securely in the crypto economy.
How real-time wallet screening works
Real-time wallet screening relies on graph analytics to evaluate transaction risk before a transfer is finalized. Rather than treating addresses as isolated endpoints, KYT platforms map the entire transaction history as a network of interconnected nodes. This structure allows compliance engines to detect hidden relationships between seemingly unrelated entities, identifying potential money laundering or terrorist financing channels that traditional rule-based systems might miss.
The process unfolds through a sequence of technical steps designed to minimize latency while maximizing depth of analysis.
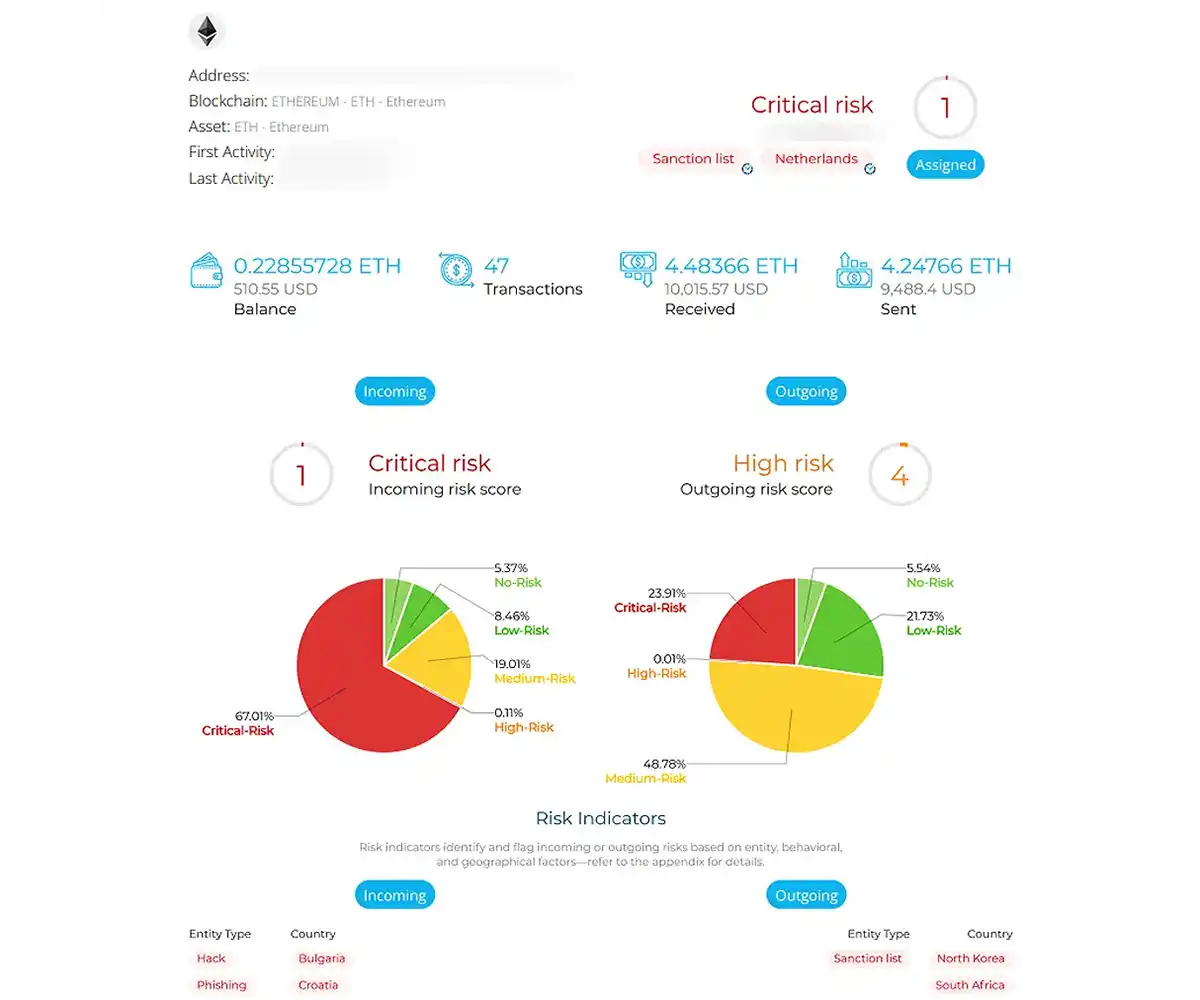
When a transaction is initiated, the system immediately ingests raw blockchain data. It normalizes this information into a standardized format, extracting sender, receiver, amount, and timestamp. This step ensures that heterogeneous data from multiple blockchains can be processed within a unified graph structure, preparing the data for immediate relationship mapping.
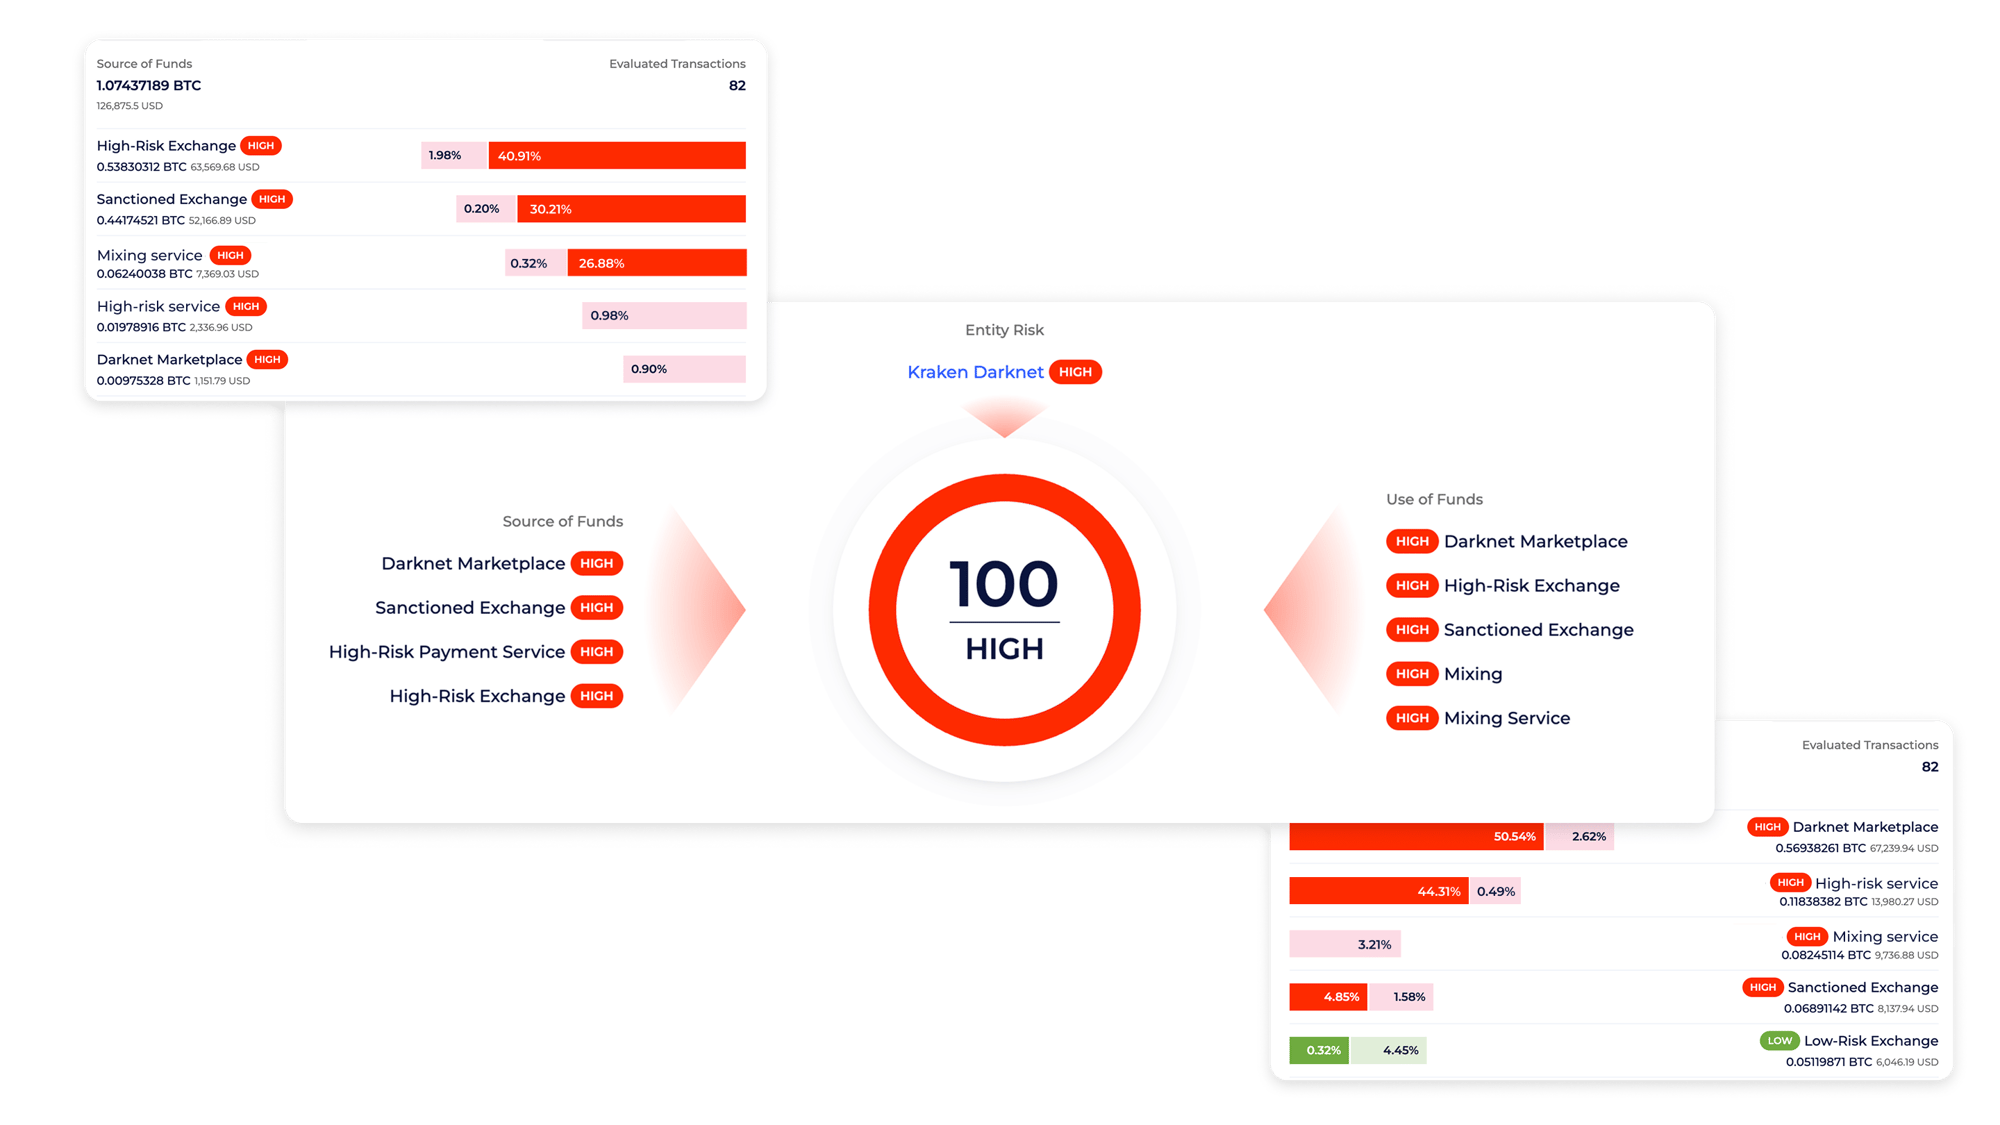
The core engine traverses the graph to uncover connections between the current transaction and historical activity. It looks for common ownership patterns, shared infrastructure, or frequent interactions with high-risk addresses. By analyzing the depth and breadth of these connections, the system builds a comprehensive profile of the wallet’s behavior and potential exposure to illicit networks.
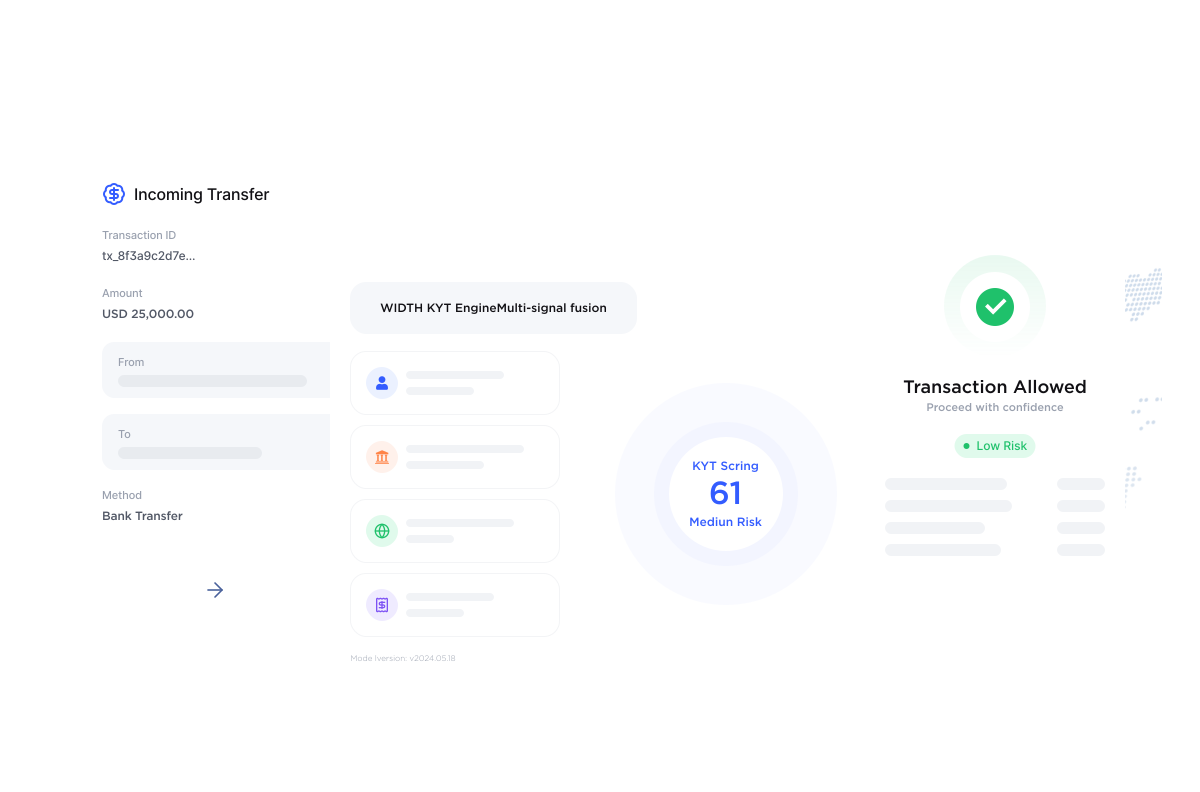
Once the relevant relationships are identified, the system applies proprietary risk scoring algorithms. These models weigh various factors, such as the type of counterparty, the velocity of transactions, and the geographic origin of funds. The result is a dynamic risk score that reflects the current threat level of the transaction, allowing for nuanced decision-making beyond simple blacklists.
The final step is the execution of the compliance decision based on the risk score. Depending on the predefined thresholds, the system may approve the transaction, flag it for manual review, or block it entirely. This decision is returned to the platform in milliseconds, ensuring that user experience is not compromised while maintaining strict regulatory adherence.
The effectiveness of this approach depends heavily on the speed and accuracy of the underlying graph database. As market volatility increases, the need for rapid, reliable screening becomes critical for maintaining operational integrity.


As an Amazon Associate, we may earn from qualifying purchases.
Top KYT graph analytics platforms
Selecting the right Know Your Transaction (KYT) solution requires evaluating how deeply a provider maps wallet relationships, how easily the API integrates with existing compliance stacks, and whether the tool covers the specific regulatory jurisdictions your operation targets. The market for graph-based screening has consolidated around platforms that prioritize real-time latency and extensive blockchain coverage.
The following comparison evaluates the leading providers based on graph depth, integration ease, and regulatory scope. These metrics reflect current capabilities for institutions requiring strict adherence to anti-money laundering (AML) standards.
| Provider | Graph Depth | Integration Ease | Regulatory Coverage |
|---|---|---|---|
| Chainalysis | Deep (Multi-hop) | High (REST/Webhooks) | Global (FATF, OFAC, EU MiCA) |
| TRM Labs | Deep (Entity Resolution) | High (API/SDK) | Global (FinCEN, FCA, MAS) |
| Elliptic | Medium (Cluster Analysis) | Medium (API/CSV) | Strong (EU, UK, US) |
| Dune Analytics | Shallow (Query-Based) | Low (SQL/Dashboard) | Limited (Community/Research) |
Integrating graph tools into compliance workflows
Deploying real-time wallet screening requires more than a simple API call; it demands a structured integration that balances speed with regulatory precision. The goal is to embed graph analytics directly into your transaction pipeline, ensuring that risk assessment happens before funds move. This approach transforms compliance from a retrospective audit into a proactive gatekeeper.
API integration and latency management
For high-volume exchanges and custodians, latency is the primary constraint. You must configure your API endpoints to handle asynchronous graph traversal queries without blocking the main transaction ledger. Kinetica’s distributed graph API, for instance, offers a way to solve complex network problems at scale while maintaining the ease of relational data access, which is critical for keeping throughput high. When integrating, prioritize endpoints that return risk scores alongside raw transaction data, allowing your internal systems to make immediate go/no-go decisions.
Reducing false positives with context
Traditional rule-based systems often flag legitimate activity due to a lack of context. Graph tools mitigate this by analyzing the broader network of relationships. By understanding the strength and direction of connections between entities, you can distinguish between a one-time interaction with a sanctioned entity and a complex, multi-hop mixing service. This contextual depth reduces the noise that compliance teams must manually review, allowing them to focus on genuine threats rather than routine administrative overhead.
Audit trails and regulatory reporting
Regulators require more than a binary pass/fail signal; they need a complete, immutable history of your decision-making process. Your integration must log every graph query, the specific nodes and edges traversed, and the resulting risk score. This audit trail serves as evidence of due diligence during regulatory examinations. Ensure that your logs capture the metadata of the graph traversal, providing a clear narrative of how a transaction was screened and why it was approved or blocked.
Frequently asked questions about KYT
What is graph data analytics?
Graph analytics evaluates information organized as objects (nodes) and their connections (edges) to understand how entities relate or could relate. In compliance, this structure maps transaction flows, revealing hidden links between wallets that traditional relational databases often miss. Pacific Northwest National Laboratory defines this as modeling the strength and direction of relationships within network data to identify patterns indicative of illicit activity.
How do knowledge graphs improve KYT screening?
Knowledge graphs combine structured data with large language models to provide context for data points. By understanding the relationships between entities, compliance teams can assess the risk of incoming and outgoing transactions more accurately. This contextual awareness allows for real-time screening that goes beyond simple address matching, identifying complex laundering schemes through graph topology.
Can graph analytics scale for real-time monitoring?
Yes. Modern distributed graph APIs solve challenging network problems at scale while maintaining the ease of relational data and SQL. This scalability is essential for high-volume crypto platforms that must assess transaction risk in real time without introducing latency. Systems like Kinetica demonstrate how graph structures can handle the volume of modern blockchain transactions while preserving analytical depth.
No comments yet. Be the first to share your thoughts!