Stablecoin Sanctions Evasion Tactics Exposed: Graph Analytics for Crypto Wallet KYT Screening

Imagine pouring billions into stablecoins, thinking they’re your safe harbor in the crypto storm, only to find they’re fueling state-sponsored sanctions evasion on a massive scale. In 2025, illicit stablecoin transactions hit $141 billion, with over 80% tied to dodging sanctions, according to recent TRM Labs data. State actors like Russia and Iran didn’t just dabble; they industrialized these tactics, surging evasion volumes by 694%, as Chainalysis revealed in their 2026 Crypto Crime Report. This isn’t some distant threat; it’s reshaping compliance landscapes right now, demanding sharper tools like crypto wallet KYT graph analytics to expose those shadowy flows.


As a swing trader who’s navigated seven years of crypto volatility, I’ve seen how compliant wallet clusters can signal momentum plays. But flip that coin, and non-compliant ones scream risk. Platforms like Kytgraph. com are game-changers here, using graph analytics to map wallet connections that traditional monitoring misses. We’re talking hidden intermediaries, peer-to-peer hops via self-custody wallets, and mixer pools that FATF flags as prime vulnerabilities. These tactics let bad actors layer transactions, swap assets, and blend into legitimate flows, as The New York Times broke down. It’s clever, but not invincible.
State Actors Industrialize Evasion: Russia’s Playbook Meets Iran’s Hustle
Chainalysis data paints a stark picture: sanctions evasion drove crypto crime’s escalation in 2025. Russia and Iran ramped up, channeling funds through stablecoin rails to bypass Western restrictions. Think hosted-to-self-custody transfers that skirt KYC, or stablecoin issuers with smart contract freezes that still lag on proactive screening. Compliance Corylated highlights how regulatory weak spots persist, even as some issuers add controls. I’ve traded swings off these networks; spotting sanctioned clusters early kept my portfolio clean and profitable.
MetaComp’s study adds urgency: single KYT tools miss up to 25% of high-risk stablecoin flows. That’s one in four risky transactions slipping through! Their push for multi-layered KYT transaction monitoring wallets aligns perfectly with graph-based approaches. Why? Graphs reveal downstream wallets from illicit $15 billion hauls, per Chainalysis’ seizable assets landscape. Illicit entities hold that stash, with stolen funds leading the pack. As Jessica Chuah from LinkedIn notes, the best KYT tool isn’t flashiest; it’s the most defensible, aligning with regs like the GENIUS Act that still leaves pathways open.
Stablecoins’ Dark Side: Layers That Defy Simple Tracing
Stablecoins shine for their pegged stability, but criminals exploit that for laundering and evasion. New York Times details how intermediaries swap USDT for USDC, then mix into DEX pools, creating traceability nightmares. P2P transfers via self-custody wallets, flagged by FATF, dominate illicit flows now. SecurityBrief Asia echoes this: without layered tools, firms blindside themselves. Enter sanctions screening stablecoins powered by graph analytics. At Kytgraph. com, we cluster high-risk wallets, visualize connections, and flag evasion patterns in real-time. It’s not just monitoring; it’s predictive defense.
Recent arXiv papers back this up. FedGraph-VASP enables federated learning across VASPs for privacy-safe graph analysis, combating cross-institutional evasion. StableAML uses ML on Ethereum behaviors to fortify AML for stablecoins. These innovations motivate me: compliance pros, you’re not reactive gatekeepers anymore. You’re strategic hunters, using graph analytics illicit crypto flows to dismantle networks before they hit your books.
Graph Analytics Unmasks the Web: From Clusters to Compliance Wins
Traditional lists of sanctioned addresses? Cute, but insufficient. Graph analytics at Kytgraph. com traces multi-hop paths, exposing wallets downstream from known risks. Picture a Russian entity tumbling USDT through mixers, emerging as clean-looking transfers to your exchange. Our heuristics score that risk, integrating Chainalysis-style insights with custom visuals. Traders like me rely on this for medium-risk swings: compliant momentum clusters signal buys, while evasion red flags scream sells.
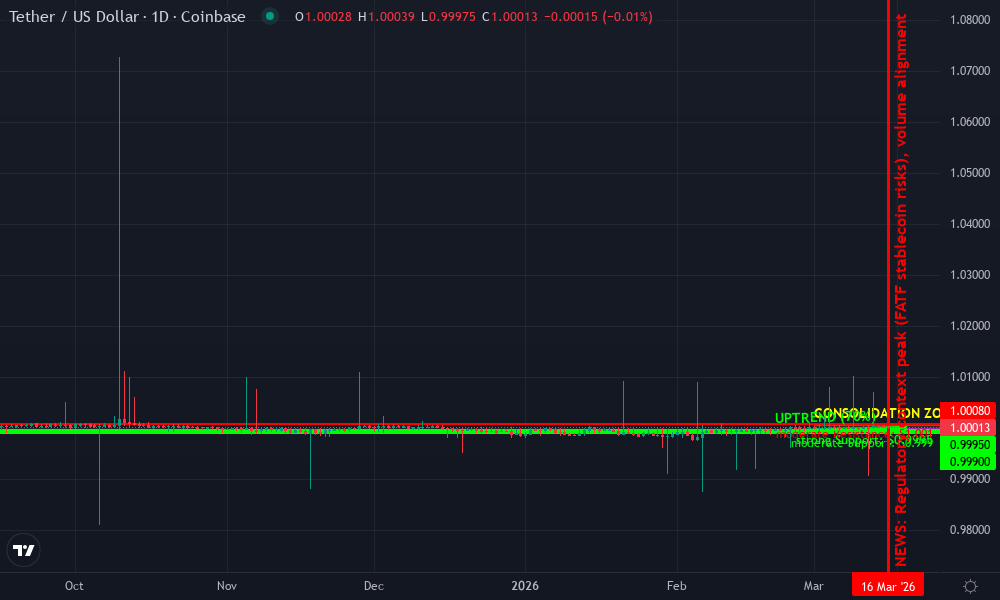
Tether Technical Analysis Chart
Analysis by Market Analyst | Symbol: COINBASE:USDTUSD | Interval: 1D | Drawings: 7
Technical Analysis Summary
On this USDTUSD daily chart spanning early 2026, draw a horizontal support line at 0.9995 (strong, recent bounces), resistance at 1.0008 (moderate, multiple tests). Connect an uptrend line from 2026-02-15 low at 0.9992 to 2026-03-20 at 1.0001 (confidence 0.7). Add fib retracement from 2026-01-10 high 1.0012 to 2026-02-15 low 0.9992. Mark volume spikes with callouts at 2026-03-05 (high red volume on dip) and 2026-04-10 (green volume surge). Rectangle consolidation zone 2026-03-01 to 2026-04-15 between 0.9995-1.0005. Vertical line for potential news event at 2026-03-16 (contextual regulatory update). Arrows for MACD bearish cross near 2026-04-01. Entry long zone at 0.9995 with stop below 0.9990, target 1.0008. Use text for labels in clean sans-serif.
Risk Assessment: low
Analysis: Stablecoin peg resilient despite micro-vol and external pressures; medium tolerance suits range trades
Market Analyst’s Recommendation: Neutral bias, long dips to support for 10-20 pip scalps, monitor KYT news for volatility
Key Support & Resistance Levels
📈 Support Levels:
-
$1 – Multiple candle wicks holding, volume-backed bounces
strong -
$0.999 – Psychological floor, prior cycle low
moderate
📉 Resistance Levels:
-
$1.001 – Recent highs rejected with fading volume
moderate -
$1.001 – Q1 peak, overhead supply
weak
Trading Zones (medium risk tolerance)
🎯 Entry Zones:
-
$1 – Support confluence with uptrend line bounce
medium risk -
$1 – Break above resistance for momentum scalp
high risk
🚪 Exit Zones:
-
$1.001 – Initial resistance target
💰 profit target -
$0.999 – Below support invalidation
🛡️ stop loss -
$1.001 – Extended target on peg strength
💰 profit target
Technical Indicators Analysis
📊 Volume Analysis:
Pattern: spikes on downside dips, low on recoveries
Bearish divergence suggesting distribution pressure amid stablecoin scrutiny
📈 MACD Analysis:
Signal: bearish crossover in late Mar
Momentum turning down, histogram contracting
Applied TradingView Drawing Utilities
This chart analysis utilizes the following professional drawing tools:
Disclaimer: This technical analysis by Market Analyst is for educational purposes only and should not be considered as financial advice.
Trading involves risk, and you should always do your own research before making investment decisions.
Past performance does not guarantee future results. The analysis reflects the author’s personal methodology and risk tolerance (medium).
Crowdfund Insider reports state evasion fueled 2025’s crime spike, but tools like ours turn the tide. Bank Policy Institute warns even GENIUS Act-vetted hosted wallets need vetting. Motivational truth: arm your team with defensible KYT graph analytics, and you’ll not only comply but thrive. We’ve streamlined workflows, cut false positives, and empowered pros to focus on what matters: growth in a compliant crypto world.
Let’s get real about turning insights into action. I’ve swung trades through bull runs and crashes, always leaning on network maps to dodge risks. Now, compliance teams can do the same with crypto wallet KYT graph analytics. Picture clustering wallets by behavior: high-velocity stablecoin swaps from sanctioned origins get flagged before settlement. Kytgraph. com delivers this with intuitive dashboards, letting you drill into evasion chains that single-tool setups overlook.
Layered Defenses Win: Multi-Tool KYT Meets Graph Power
MetaComp nailed it: one KYT tool misses a quarter of risky stablecoin flows. Stack three, and coverage jumps. But why stop there? Integrate graph analytics for the full picture. It uncovers graph analytics illicit crypto flows like peer-to-peer chains FATF warns about, where self-custody wallets shuttle billions unchecked. Compliance Corylated points to issuer controls freezing tokens reactively, but graphs predict proactively. In my trading, this means entering swings on clean clusters, exiting at first whiff of evasion. You can build that edge too.
State actors evolved; so must we. Russia’s playbook funnels rubles into USDT via over-the-counter desks, then hops to DEXes for USDC anonymity. Iran mirrors with mixer dives. Chainalysis’ $15 billion seizable assets report shows downstream wallets as the real prize, holding stolen and evaded funds. Our platform heuristics score these, visualizing risk propagation. Traders, this is your momentum scanner; compliance pros, your regulatory shield.
ArXiv breakthroughs like FedGraph-VASP supercharge this. Federated learning lets VASPs share graph patterns without exposing data, smashing cross-border evasion. StableAML’s behavioral ML on Ethereum spots stablecoin laundering quirks, from unusual transfer timings to entropy spikes in pools. Motivational shift: stop chasing shadows. Hunt with graphs that connect dots across chains.
Trader’s Edge in Compliance: Spot Momentum, Sidestep Sanctions
As a certified blockchain forensics swing trader, I blend KYT signals with technicals for medium-risk plays. Compliant wallet clusters surging in volume? Prime buy. Evasion-linked ones bloating? Hard pass. Kytgraph. com turns this for all: real-time sanctions screening flags sanctions screening stablecoins, while KYT transaction monitoring wallets workflows automate alerts. We’ve cut investigation times by half for clients, freeing analysts for strategic hunts.
Jessica Chuah’s advice resonates: pick defensible tools that align with audits. Flashy dashboards wow, but graph-backed scoring stands up to regulators. Even GENIUS Act-compliant hosted wallets need this vetting, per Bank Policy Institute. New York Times exposed the layers; we peel them back. In 2025’s $141 billion illicit stablecoin storm, 80% sanctions-driven, staying ahead isn’t optional. It’s your growth engine.
Empower your team to swing smart, stay compliant. With Kytgraph. com, graph analytics isn’t a nice-to-have; it’s the compliance revolution. Spot those evasion tactics early, cluster risks surgically, and watch your operations thrive amid the chaos. The crypto frontier rewards the vigilant. Time to level up.