Why graph analytics matter now
Traditional anti-money laundering (AML) strategies rely heavily on static address screening, a method that treats cryptocurrency addresses as isolated, one-dimensional data points. This approach is fundamentally insufficient for detecting sophisticated laundering techniques. Criminals rarely move illicit funds through a single wallet; instead, they utilize complex networks of transactions designed to obscure the origin of funds. Static screening misses these hidden connections, failing to identify the underlying structure of money movement.
Graph analytics addresses this limitation by mapping relationships between addresses. By visualizing transactions as nodes and edges, compliance teams can identify patterns that static lists cannot. For instance, a single address may appear clean in isolation, but if it interacts with known mixing services or tumblers, the graph reveals the illicit context. This dynamic analysis allows institutions to flag suspicious activity based on behavior and association rather than just a blacklisted string of characters.
Regulatory bodies are increasingly recognizing the inadequacy of basic screening. The Financial Action Task Force (FATF) has emphasized the need for virtual asset service providers (VASPs) to understand the source and destination of funds. Graph analytics provides the necessary depth to meet these expectations. It transforms compliance from a reactive checklist into a proactive risk management tool, enabling firms to mitigate exposure to high-risk entities before transactions are completed.
The shift to graph-based analysis is not merely a technological upgrade; it is a regulatory necessity. As money laundering techniques become more complex, relying on static data leaves institutions vulnerable to significant financial and reputational damage. Graph analytics offers the visibility required to navigate this evolving landscape effectively.
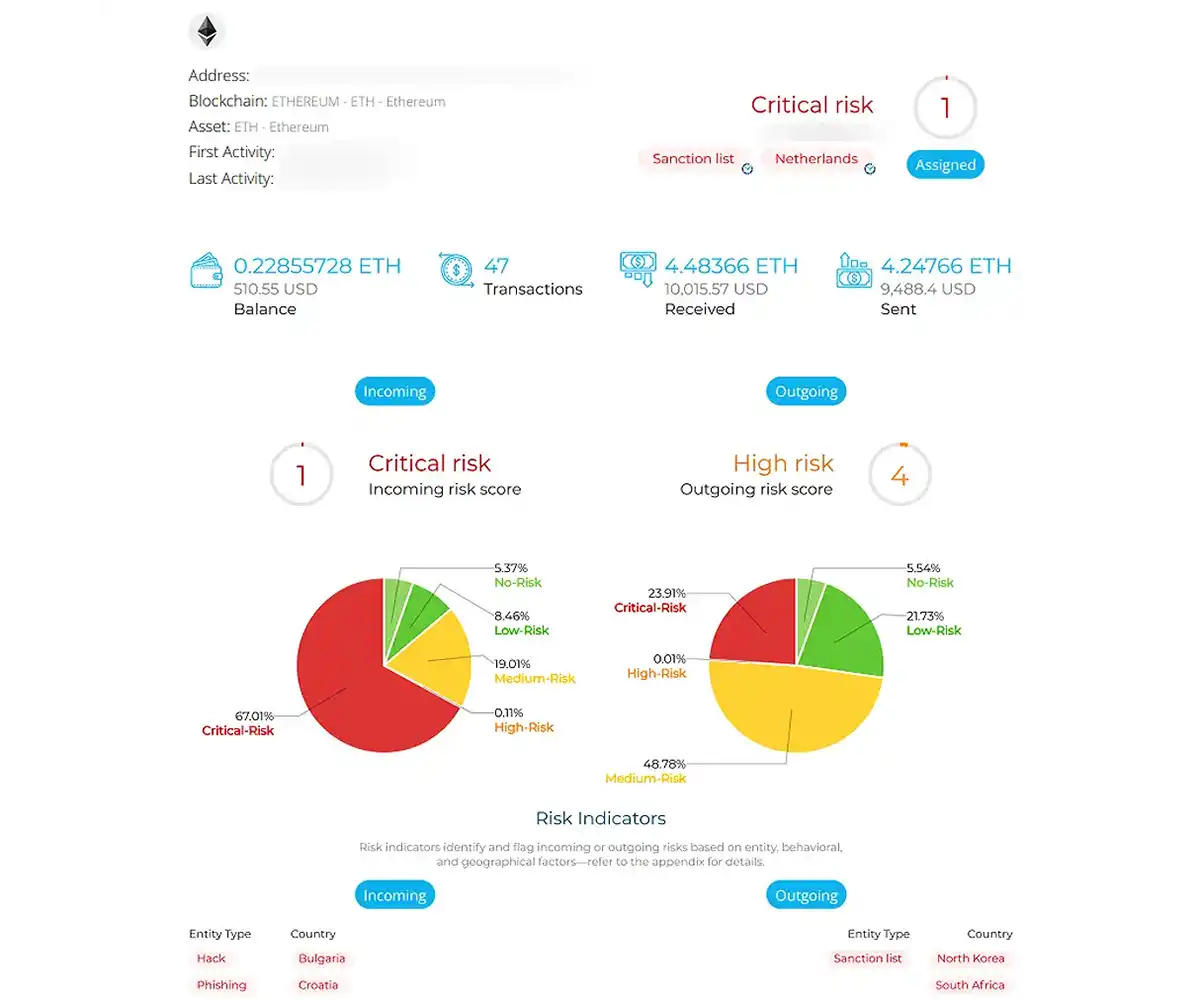
How KYT graph structures data
Know Your Transaction (KYT) systems rely on node-link data structures to map the complex web of cryptocurrency interactions. In this model, individual addresses or accounts serve as nodes, while the transactions between them form the connecting edges. This structure allows compliance teams to move beyond isolated wallet analysis and instead view the entire ecosystem as a connected network.
The primary value of this graph topology lies in its ability to identify clusters. By analyzing transaction patterns, such as common input ownership or change address detection, KYT engines group distinct addresses that likely belong to a single entity. This clustering is essential for determining the true beneficial owner behind a transaction, a requirement for many regulatory frameworks.
Graph analytics also excel at detecting layering techniques used in money laundering. Illicit actors often attempt to obscure the origin of funds by moving assets through multiple intermediaries. The graph structure visualizes these flows, allowing algorithms to identify specific patterns, such as rapid transactions through mixing services or tumblers. These services are designed to break the link between the sender and the receiver, but the underlying graph connections often remain traceable.
To understand how these connections are visualized, consider the following example of a KYT graph structure.
The technical mechanism involves assigning risk scores to nodes and edges based on their connections to known bad actors. A node connected to a high-risk cluster inherits a portion of that risk, creating a contagion effect that propagates through the network. This dynamic scoring enables real-time monitoring, allowing institutions to flag suspicious activity before it is completed. The ability to trace these indirect connections is what separates modern KYT solutions from traditional, address-based screening methods.
Real-time graph analysis vs. batch processing
Traditional anti-money laundering (AML) workflows often rely on end-of-day batch processing, a method that introduces significant latency between transaction execution and risk assessment. In this model, financial institutions review historical data sets at fixed intervals, typically overnight. While this approach reduces immediate computational load, it creates a critical window of vulnerability where illicit funds can be layered, mixed, or withdrawn before detection.
Real-time graph analytics fundamentally alters this risk profile by evaluating transactions as they occur. By mapping relationships between entities—such as wallets, exchanges, and mixers—instantaneously, compliance teams can identify suspicious patterns like rapid layering through tumblers or interactions with sanctioned addresses before the transaction settles. This shift from retrospective analysis to proactive intervention is essential for mitigating exposure in high-frequency trading environments.
The operational differences between these two methodologies are stark. Real-time graph analysis requires robust infrastructure to maintain low latency, but it offers superior detection rates for complex, multi-hop money laundering schemes. Batch processing, while simpler to implement, often fails to capture the dynamic nature of modern crypto crime, where assets move across dozens of hops in seconds.
The following comparison outlines the key distinctions in latency, detection capabilities, and operational impact.
| Metric | Batch Processing | Real-Time Graph |
|---|---|---|
| Latency | Hours to days | < 1 second |
| Detection Scope | Single transaction focus | Multi-hop relationship mapping |
| False Positive Rate | Higher (context-limited) | Lower (context-rich) |
| Regulatory Alignment | Reactive compliance | Proactive risk mitigation |
2026 Regulatory Expectations for Traceability
The regulatory landscape for 2026 is shifting from reactive monitoring to proactive, real-time traceability. Regulators are no longer satisfied with post-transaction reporting; they expect institutions to identify illicit flows as they occur. This shift demands that AML systems integrate graph analytics capable of mapping complex transaction networks instantly, rather than relying on batch processing that lags behind the speed of digital asset movement.
Expanded Sanctions Screening and Mixer Interactions
A primary focus for 2026 compliance is the rigorous screening of interactions with privacy-enhancing tools. Regulators, including the Financial Action Task Force (FATF), have explicitly warned against the use of mixers and tumblers for money laundering. Compliance programs must now detect and flag transactions involving known mixing services, such as Tornado Cash, with zero tolerance. The expectation is not merely to identify these addresses but to understand the context of the interaction—whether it was a direct deposit or part of a layered obfuscation strategy.
Full-Chain Visibility and Source of Funds
Institutions are expected to maintain full-chain visibility for high-risk transactions. This means tracing the origin of funds back to their source, not just the immediate counterparty. For example, if a large transfer originates from a wallet that previously interacted with a sanctioned entity, the system must flag the entire lineage. This level of granularity requires graph analytics to map relationships across multiple hops, ensuring that no layer of obfuscation goes undetected. The goal is to provide auditors with a clear, unbroken chain of custody for every significant asset movement.
Automated Reporting and Real-Time Alerts
The final pillar of 2026 expectations is the automation of reporting. Manual review is insufficient for the volume of transactions processed by modern financial institutions. Systems must automatically generate Suspicious Activity Reports (SARs) when predefined risk thresholds are breached. This includes real-time alerts for transactions that match known illicit patterns, such as rapid movement through multiple unhosted wallets or interactions with darknet markets. The emphasis is on reducing the time between detection and regulatory notification, ensuring that institutions can demonstrate immediate action in the face of emerging threats.
Common Graph Analytics Pitfalls
Graph-based Know Your Transaction (KYT) systems promise to map illicit networks, but their effectiveness collapses without rigorous data hygiene. The primary failure mode is not algorithmic complexity, but the quality of the underlying ledger data. When node resolution is poor or transaction metadata is sparse, the graph becomes a noisy map that obscures rather than reveals risk.
False positives often stem from ambiguous node linking. A single wallet address might represent multiple users, or conversely, a single entity might control numerous addresses through complex clustering. Without robust identity resolution, compliance teams waste resources investigating benign activity. For instance, a legitimate user interacting with a mixer for privacy reasons may trigger the same alert as a money launderer using the same service to obscure illicit proceeds. Distinguishing between intent and mere interaction requires more than topological proximity.
Data quality issues further compound these errors. Incomplete transaction histories or missing counterparty information create "orphaned" nodes that distort centrality metrics. If the graph cannot accurately trace the source or destination of funds, risk scores become unreliable. This is particularly dangerous in high-stakes environments where regulatory adherence is mandatory. A system that flags 90% of transactions as suspicious due to poor data quality is functionally useless, as it overwhelms investigators with noise.
To mitigate these risks, institutions must prioritize data validation and continuous monitoring of graph topology. Regular audits of node-linking logic and transaction enrichment processes are essential. Only by ensuring the integrity of the graph's foundation can compliance teams trust the signals generated by the analytics engine.
No comments yet. Be the first to share your thoughts!