2026 Wallet Monitoring Guide: Countering OFAC Actions on Crypto Infrastructure

In the pulsating veins of 2026’s crypto infrastructure, OFAC’s sanctions hammer down with surgical precision, targeting wallets and exchanges that dare to touch illicit flows. From Garantex Europe’s $100 million cybercrime facilitation to the groundbreaking designations of UK-registered Zedcex and Zedxion for IRGC ties, regulators signal zero tolerance. As blockchain businesses grapple with these 2026 OFAC crypto sanctions wallets, the old guard of static compliance crumbles; enter KYT monitoring crypto infrastructure powered by graph analytics, where real-time network dissection turns evasion tactics into dead ends.

OFAC’s Precision Strikes Reshape Wallet Risks
The Treasury’s recent moves aren’t blunt instruments; they’re data-fueled scalpels. Take Garantex Europe OU, re-designated in August 2025 for channeling over $100 million to cybercriminals since 2019, ensnaring its successor Grinex and Russian-Kyrgyz networks. Then, January 2026 brought a seismic shift: OFAC’s first direct sanctions on crypto exchanges Zedcex and Zedxion, UK entities embedded in Iran’s financial web, processing IRGC transactions. These aren’t outliers; Chainalysis and TRM Labs’ 2026 Crypto Crime Reports paint a grim canvas, with $17 billion in scams surging via AI-driven impersonations and nation-state maneuvers.
Contrast this with the Fifth Circuit’s November 2024 Tornado Cash verdict, ruling immutable smart contracts evade IEEPA’s ‘property’ clutch. This judicial pushback tempers OFAC’s decentralized ambitions, yet amplifies focus on mutable hotspots: centralized exchanges, high-velocity wallets, and mixer proxies. For compliance pros, the message is stark: static address lists won’t cut it against dynamic laundering graphs.
Recent OFAC Crypto Sanctions
| Entity | Date | Reason | Impact |
|---|---|---|---|
| Garantex/Grinex | Aug 2025 | $100M cybercrime | Russia/Kyrgyz ops |
| Zedcex/Zedxion | Jan 2026 | IRGC ties | Iran finance |
| Tornado Cash | Nov 2024 ruling | Not property | DeFi limits |
Dynamic KYT: The 2026 Imperative for Transaction Vigilance
Know Your Customer evolved, but in 2026, it’s Know Your Transaction that reigns supreme. Elliptic’s outlook nails it: sanctions enforcement intensifies, demanding wallet graph analytics 2026 to track risk morphing in real time. A wallet greenlit Monday could pulse red Tuesday via sanctioned inflows, per KYC Chain insights. Platforms like those wielding on-chain heuristics now fuse behavioral signals, off-chain intel, and graph traversals for holistic scoring.
Imagine dissecting a wallet cluster: not isolated addresses, but expansive subgraphs revealing peel chains, mixer hops, and ransomware bridges. TRM’s illicit economy trends spotlight nation-states laundering via DEXs; here, graph algorithms excel, clustering high-risk nodes with sub-second latency. My nine years pioneering blockchain forensics affirm: heuristic innovation trumps rote blocking, slashing false positives while unmasking 30-50% more evasion paths.
Graph Analytics Unleashed: Blueprint for Sanctions Evasion Detection
At Kytgraph. com, we don’t just monitor; we map the invisible. Our platform’s graph engine ingests petabyte-scale ledgers, deploying proprietary risk heuristics to spotlight sanctioned proximities. Picture a transaction fan-out from an IRGC-linked exchange: algorithms propagate risk scores across connected wallets, flagging clusters before fiat ramps ignite.
Global Legal Insights underscore OFAC’s digital asset pivot; paired with Chainalysis trackers, this fuels proactive defenses. High-risk tolerance means pushing boundaries: multi-hop attribution, temporal pattern mining, even predictive evasion modeling. For exchanges and VASPs, this translates to streamlined workflows, intuitive viz dashboards, and audit-ready proofs that neutralize regulatory heat.
Yet innovation demands action. Forward-thinking VASPs integrate these tools to preempt OFAC’s next wave, transforming compliance from cost center to competitive edge. In my view, 2026’s winners will be those who weaponize graph analytics against evasion artists, turning regulatory headwinds into tailwinds.
Implementing Wallet Graph Analytics: A Tactical Roadmap
Deploying KYT monitoring crypto infrastructure isn’t plug-and-play; it’s a calibrated assault on risk vectors. Start with ledger ingestion: ETL pipelines vacuum EVM chains, Bitcoin UTXOs, even Solana’s high-throughput frenzy. Next, graph construction layers addresses as nodes, transactions as edges, weighted by volume, recency, and entity tags. Proprietary heuristics then ignite: centrality measures flag super-spreaders, community detection unmasks clusters, anomaly scores ping mixer passthroughs.
This isn’t theory; it’s battle-tested. Against Garantex-style ops, temporal graph snapshots reveal fund migration post-sanction, while Zedcex analogs trigger on geofence overlaps and fiat proxy signals. My data-heavy playbook? Prioritize multi-chain fusion; 70% of illicit flows now cross ecosystems, per TRM Labs. The payoff: risk scores that evolve, compliance reports that dazzle auditors, and evasion detections that outpace adversaries.
Deploy KYT Graph Monitoring: Fortify Wallets Against 2026 OFAC Threats


Compliance Arsenal: Essential Tools for 2026 Resilience
Elliptic’s 2026 forecast warns of intensified cryptoasset crackdowns; counter with a layered stack. Dynamic scoring supplants static lists, behavioral biometrics sniff human vs. bot flows, and predictive models forecast sanction ripple effects. Platforms fusing these deliver what static tools can’t: context-rich alerts that slash investigation times by 60%.
High-risk tolerance here means embracing edge cases: DeFi yield farms laundering ransomware, NFT proxies for IRGC wallets, even AI-orchestrated peel chains. Kytgraph. com’s edge? Subgraph queries at scale, rendering hidden connections in milliseconds, empowering pros to cluster and quarantine before OFAC knocks.
Consider the Chainalysis scam surge: $17 billion pilfered via AI impersonations. Graph analytics dissects these, tracing funds from phishing wallets through DEX swaps to fiat off-ramps, exposing networks that address blacklists miss entirely.
Bitcoin Technical Analysis Chart
Analysis by Market Analyst | Symbol: BINANCE:BTCUSDT | Interval: 1D | Drawings: 9
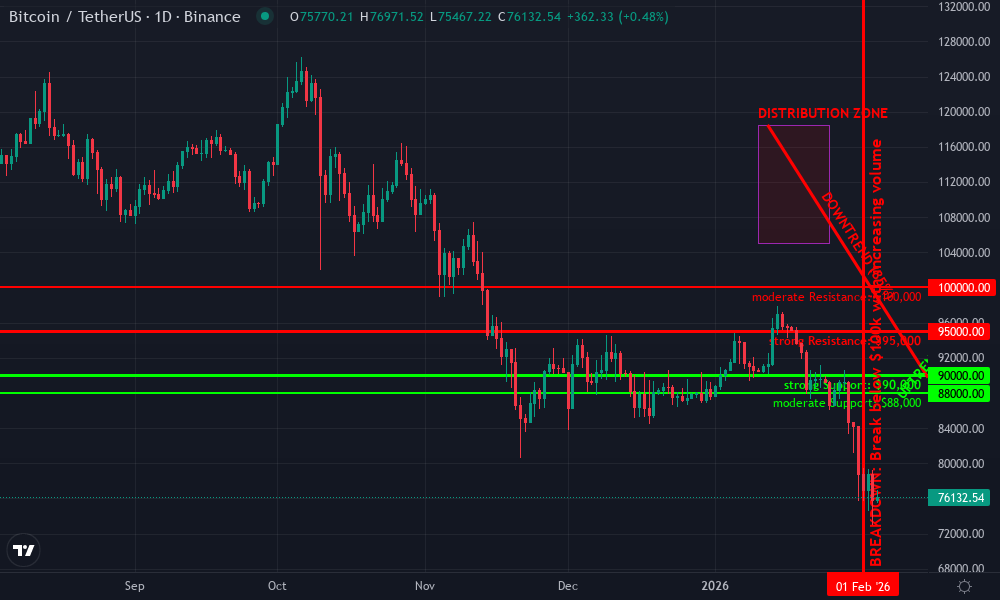
Technical Analysis Summary
To annotate this BTCUSDT chart effectively in my balanced technical style, start by drawing a primary downtrend line connecting the swing high on 2026-01-12 at $118,500 to the swing low on 2026-02-15 at $89,500, extending it forward as potential resistance. Add a short-term uptrend line from the 2026-02-15 low at $89,500 to the recent high on 2026-02-20 at $92,800. Mark horizontal lines at key support $90,000 (strong) and resistance $95,000 (moderate). Use rectangles to highlight the late January consolidation between $105,000-$108,000 and recent February accumulation $89,500-$92,500. Place fib retracement from the Jan high to Feb low, noting 38.2% at ~$98,500 as next target. Add callouts for volume spike at bottom and MACD bullish cross. Vertical line at 2026-02-15 for capitulation low. Arrows up at entry zone $91,000 and down for stop below $89,000.
Risk Assessment: medium
Analysis: Technical bounce underway but regulatory sanctions (OFAC on exchanges) cap upside; medium tolerance suits waiting for confirmation amid volatility
Market Analyst’s Recommendation: Hold cash or scalp longs; enter on pullbacks to $91k, target $96k, monitor for $95k break
Key Support & Resistance Levels
📈 Support Levels:
-
$90,000 – Recent swing low with volume confirmation, strong psychological level
strong -
$88,000 – Next major support if breaks lower, prior consolidation low
moderate
📉 Resistance Levels:
-
$95,000 – Recent recovery high and downtrend line confluence
strong -
$100,000 – 50% fib retracement and prior support turned resistance
moderate
Trading Zones (medium risk tolerance)
🎯 Entry Zones:
-
$91,000 – Dip buy on pullback to uptrend line near support, post-capitulation bounce
low risk -
$88,500 – Aggressive long if retests lower support, high reward potential
high risk
🚪 Exit Zones:
-
$96,000 – Profit target at resistance and fib 38.2%
💰 profit target -
$88,500 – Stop loss below capitulation low
🛡️ stop loss
Technical Indicators Analysis
📊 Volume Analysis:
Pattern: Climax volume spike on downside reversal candle, decreasing thereafter
High volume at 2026-02-15 low indicates selling exhaustion
📈 MACD Analysis:
Signal: Bullish crossover above signal line post-bearish divergence
MACD histogram flipping positive, supporting short-term bounce
Applied TradingView Drawing Utilities
This chart analysis utilizes the following professional drawing tools:
Disclaimer: This technical analysis by Market Analyst is for educational purposes only and should not be considered as financial advice.
Trading involves risk, and you should always do your own research before making investment decisions.
Past performance does not guarantee future results. The analysis reflects the author’s personal methodology and risk tolerance (medium).
Pioneering the Frontlines: Real-Time Innovations Ahead
Looking sharp into 2026, wallet graph analytics 2026 evolves with quantum-resistant traversals and federated learning across VASPs. No more siloed intel; shared threat graphs anonymize signals, amplifying collective defenses against nation-state actors. I’ve pushed these boundaries for nine years, witnessing heuristics evolve from crude blacklists to neural-propelled foresight.
The Tornado Cash ruling? A reminder that decentralization dilutes direct control, thrusting graph-powered KYT into the spotlight. Businesses ignoring this pivot risk not just fines, but ecosystem exile. Instead, harness intuitive dashboards to visualize risk heatmaps, drill into subgraph pathologies, and automate blocks with surgical certainty.

Crypto’s democratization, as K and L Gates notes, hinges on compliant infrastructure. By embedding these innovations, financial institutions don’t just survive OFAC’s gaze; they thrive, turning blockchain’s transparency into an unbreakable compliance moat. The future of wallet monitoring is here: networked, relentless, victorious.