Graph Analytics for Detecting Stablecoin Sanctions Evasion in Crypto Wallets

In the shadowed corridors of the cryptocurrency ecosystem, stablecoins have emerged as the preferred vehicle for sanctions evasion, channeling illicit flows with unprecedented scale and sophistication. Recent analyses reveal that illicit stablecoin transactions hit a five-year high of $141 billion in 2025, with over 80% tied directly to sanctions evasion activities. Russian-linked wallets alone funneled $8 billion through Tether’s USDT to skirt international restrictions, underscoring how these dollar-pegged assets enable sanctioned entities to access global liquidity pools seamlessly. This surge demands a shift from reactive monitoring to proactive KYT sanctions screening, where graph analytics illuminate the hidden webs of wallet connections fueling illicit stablecoin flows.

Stablecoins: The Linchpin of Modern Sanctions Evasion
Stablecoins like USDT and emerging tokens such as Russia’s A7A5 have transformed sanctions evasion from a fringe tactic into a structural feature of crypto crime. TRM Labs reports illicit crypto inflows reaching $158 billion in 2025, with stablecoins dominating due to their stability and liquidity. Unlike volatile assets, they mimic fiat without the oversight, allowing actors from Russia to Houthi networks to bridge prohibited corridors. Chainalysis tracked eight wallets linked to nearly $1 billion in flows for Houthi sanctions evasion, highlighting how concentrated illicit networks exploit stablecoin rails.
Key Stats on 2025 Illicit Stablecoin Flows
| Statistic | Value | Details |
|---|---|---|
| Total Illicit Stablecoin Flows | $141B | Five-year high (Source: TRM Labs, Cointelegraph) |
| Sanctions Evasion Share | 80% | Of total illicit stablecoin activity |
| Russian USDT Flows | $8B | Linked wallets circumventing sanctions via Tether (Source: CryptoSlate) |
| A7A5 Token Volume | $93.3B+ | Russia’s parallel stablecoin system for evasion (Source: TRM Labs) |
| YoY Growth | 162% | In illicit crypto inflows, driven by stablecoins (Source: TRM Labs) |
These networks thrive on opacity. Sanctioned entities layer transactions through mixers, privacy coins, and cross-chain bridges, embedding evasion within legitimate traffic. Traditional heuristics flag known addresses but miss the dynamic clustering of high-risk wallets. Here, crypto wallet graph analytics proves indispensable, mapping transaction proximities to expose clusters invisible to linear tools.
Unmasking Illicit Networks with Transaction Graph Mapping
Graph analytics dissects the blockchain as a relational web, where nodes represent wallets and edges denote fund flows. In sanctions evasion, sanctioned wallets rarely transact directly with compliant exchanges; instead, they peel through intermediaries. The ‘Transaction Proximity’ method, for instance, quantifies graph distances between suspect wallets and centralized platforms, flagging those within one or two hops of known risks. This approach detects peeling chains – incremental outflows designed to evade thresholds – with far greater precision than volume-based alerts.
Proactive compliance prevents punitive realities.
Consider Russia’s pivot: flows from 2022-2025 routed illicit liquidity to top CEXs via stablecoins, evading monitoring through fresh wallet generation. Graph tools cluster these by behavioral heuristics, such as rapid in-out patterns or ties to VPN-masked IPs. Platforms like Kytgraph. com deploy such wallet risk heuristics, visualizing multi-hop paths in real-time dashboards for compliance teams.
Advanced Frameworks: FedGraph-VASP and Beyond
To counter cross-institutional silos, innovations like FedGraph-VASP enable privacy-preserving federated learning on transaction graphs. VASPs share aggregated insights without exposing raw data, amplifying detection of stablecoin sanctions evasion across ecosystems. This federated model aggregates signals from disparate blockchains, identifying global patterns like the $154 billion received by illicit addresses in 2025, up 162% year-over-year.
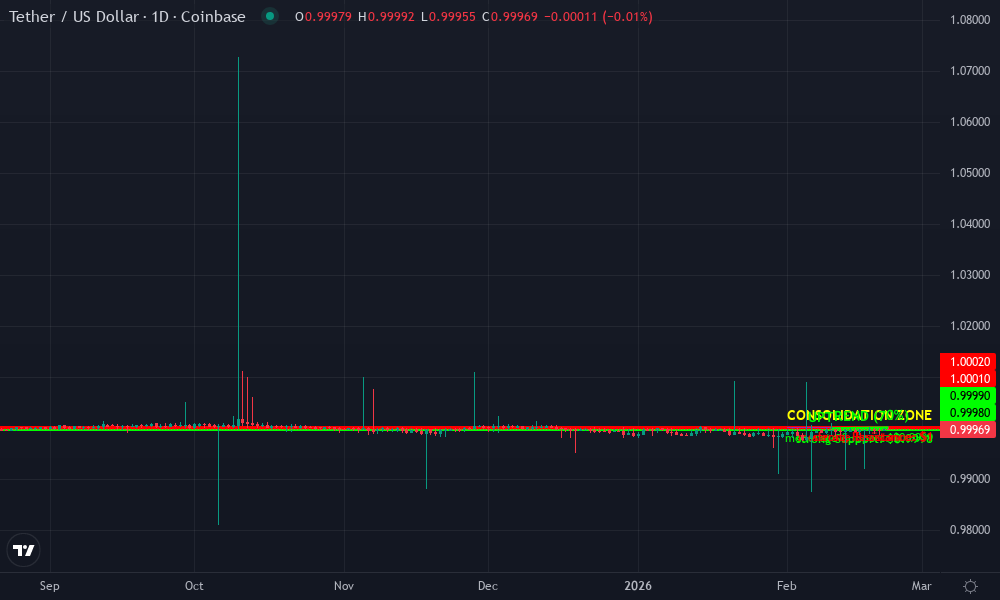
Tether USDT Technical Analysis Chart
Analysis by Market Analyst | Symbol: COINBASE:USDTUSD | Interval: 1D | Drawings: 6
Technical Analysis Summary
As a seasoned technical analyst with 5 years focusing on pure price action and key indicators, start by drawing horizontal lines at key support (0.9998) and resistance (1.0002) levels spanning the entire visible chart period from early January to mid-March 2026 to highlight the ultra-tight peg range. Add a flat trendline connecting the highs around 1.0000-1.0002 from 2026-01-15 to 2026-03-10 for the upper boundary (low confidence uptrend due to stability). Draw a rectangle for the consolidation zone from 2026-02-01 to 2026-02-22 between 0.9998 and 1.0002. Mark volume spikes with arrow_mark_up at 2026-02-10 low where volume confirmed support bounce. For MACD, add arrow_mark_up at recent bullish crossover around 2026-02-20. Entry long at 0.9999 with stop below 0.9997, target 1.0001. Use callouts for special events like potential sanctions news impact on 2026-02-22.
Risk Assessment: low
Analysis: USDT’s peg is battle-tested even with 2025-2026 illicit flows hitting $141B+; tight range limits volatility, suits medium tolerance
Market Analyst’s Recommendation: Hold core position, scale in longs on dips to 0.9999 targeting 1.0002; avoid overleverage given stablecoin nature
Key Support & Resistance Levels
📈 Support Levels:
-
$1 – Strong peg floor tested multiple times with volume spikes
strong -
$1 – Intermediate support on minor pullbacks
moderate
📉 Resistance Levels:
-
$1 – Near-term cap on upside wicks
moderate -
$1 – Historical peg ceiling, heavy selling volume
strong
Trading Zones (medium risk tolerance)
🎯 Entry Zones:
-
$1 – Bounce from strong support with rising volume, aligned to medium risk longs
medium risk -
$1 – Mid-range accumulation for scalps if consolidation persists
low risk
🚪 Exit Zones:
-
$1 – Profit target at resistance confluence
💰 profit target -
$1 – Tight stop below key support to limit downside
🛡️ stop loss -
$1 – Stretch target on breakout
💰 profit target
Technical Indicators Analysis
📊 Volume Analysis:
Pattern: Increasing on dips, confirming support holds
Volume spikes at 0.9998 lows signal accumulation amid sanctions flow news
📈 MACD Analysis:
Signal: Bullish crossover emerging
MACD line crossing signal from below, hinting mild recovery momentum
Applied TradingView Drawing Utilities
This chart analysis utilizes the following professional drawing tools:
Disclaimer: This technical analysis by Market Analyst is for educational purposes only and should not be considered as financial advice.
Trading involves risk, and you should always do your own research before making investment decisions.
Past performance does not guarantee future results. The analysis reflects the author’s personal methodology and risk tolerance (medium).
By embedding economic prisms – weighting edges by value, velocity, and vintage – graph analytics assigns nuanced risk scores. A wallet proximal to OFAC-listed entities, even indirectly, inherits elevated scrutiny under sanctions compliance crypto regimes. This layered intelligence empowers fintechs to preempt OFAC actions, transforming compliance from cost center to strategic edge.
Yet the true power lies in operationalizing these tools for daily KYT sanctions screening. Compliance teams at global fintechs now integrate graph-based risk heuristics into automated workflows, scoring wallets not just on direct exposure but on network centrality. A Russian entity’s wallet, for example, might appear clean in isolation, but graph traversal reveals its position as a nexus in a $93.3 billion A7A5 stablecoin web, transacting volumes that dwarf legitimate DeFi plays. This structural embedding – where evasion mirrors market dynamics – demands analytics that evolve with actor sophistication.
Case Study: Dissecting Russia’s Stablecoin Evasion Pipeline
From 2022 to 2025, Russian flows exemplify the challenge. Investigations trace how sanctioned liquidity entered top CEXs via USDT peeling chains: sanctioned wallets dispatch micro-transactions to intermediaries, which consolidate and launder through exchanges like ABCeX. Graph analytics cuts through this by constructing directed acyclic graphs (DAGs) of fund paths, applying PageRank-like algorithms to prioritize high-influence nodes. Kytgraph. com’s platform excels here, rendering interactive visualizations where users drill from cluster overviews to granular hop-by-hop audits.
Take the Houthi network: Chainalysis identified eight wallets handling nearly $1 billion, funneled via stablecoins and mixers. Traditional tools flagged endpoints; graph methods retroactively mapped the full ingress, exposing upstream Russian bridges. Such retrospectives inform forward-looking models, training machine learning on evasion signatures like velocity spikes post-sanction announcements.
Five exchanges have faced scrutiny for enabling these vectors, underscoring the need for upstream intervention. By clustering high-risk wallets pre-onramp, institutions deny liquidity at the source, collapsing evasion economics.
Wallet Risk Heuristics: From Detection to Mitigation
Advanced wallet risk heuristics elevate graph analytics beyond alerts. Kytgraph. com fuses temporal graphs – tracking edge evolution over time – with entity resolution, de-anonymizing clusters via off-chain signals like IP geolocation proxies. A wallet’s risk score compounds factors: proximity to OFAC lists (shortest path length), transaction entropy (mixing efficiency), and economic vintage (age of funds). Scores above 75 trigger enhanced due diligence, preempting the punitive fines that have reshaped crypto compliance.
This conservative lens views evasion not as isolated crimes but systemic pressures. Stablecoins’ $141 billion illicit peak reflects market forces – sanctioned economies seek dollar parity amid fiat isolation. Graph tools quantify this, enabling risk-adjusted onboarding where VASPs calibrate exposure by jurisdiction. Fintechs adopting these report 40% faster screening cycles, with false positives halved through behavioral baselines.
Illicit networks concentrate power in few wallets; graph analytics disperses that advantage to the compliant.
Federated frameworks like FedGraph-VASP scale this globally, letting institutions collaborate without data sovereignty breaches. As illicit addresses absorbed $154 billion in 2025 – a 162% surge – shared graph intelligence proves the bulwark against proliferation.
The Compliance Horizon: Graph Analytics as Strategic Imperative
Looking ahead, stablecoin dominance in evasion will intensify with tokenized real-world assets and layer-2 scaling. Regulators like OFAC signal tighter graph disclosure mandates, rewarding early adopters. Platforms such as Kytgraph. com position compliance professionals at this vanguard, delivering real-time sanctions screening that turns regulatory headwinds into competitive moats.
Entities ignoring these tools risk entanglement in the next enforcement wave, as seen with exchanges blind to Russian pipelines. Proactive graph deployment – mapping, scoring, mitigating – fortifies balance sheets against the realities of weaponized finance. In crypto’s maturing arena, those who master the relational web thrive; the rest navigate shadows at their peril.