Graph Analytics for Detecting Sanctions Risks in Crypto Wallet Clusters

In the opaque world of cryptocurrency transactions, where wallets connect through invisible threads of blockchain data, graph analytics emerges as the sharpest tool for unmasking sanctions risks. Traditional list-matching falls short against sophisticated evasion tactics, but by mapping wallets as nodes and transfers as edges, compliance teams can reveal clusters teeming with high-risk activity. This approach, central to KYT sanctions screening, transforms raw blockchain data into actionable intelligence, spotting patterns that signal money laundering or ties to prohibited entities before they cascade through your platform.


Unraveling Crypto Wallet Clustering with Graph Structures
Crypto wallet clustering lies at the heart of effective graph analytics for crypto wallets. Unlike solitary addresses, wallets often operate in ensembles, controlled by the same entity and linked via shared inputs or behavioral heuristics. Advanced platforms employ unsupervised learning to group these, forming supernodes that represent real-world actors. Consider a cluster funneling funds through mixers: isolated checks might clear it, but graph views expose the convergence of inflows from exchanges and outflows to dark markets.
I’ve analyzed countless such graphs over a decade, and the revelation comes from density metrics. High-degree nodes, bombarded by transactions from sanctioned jurisdictions, demand scrutiny. Tools like those from Chainalysis aggregate this into KYT crypto transaction monitoring, scaling to millions of edges without losing precision. Real-time ingestion ensures clusters update dynamically, catching morphing risks mid-flow.
Graph Patterns That Betray Sanctions Evasion
Sanctions evasion thrives on obfuscation, yet blockchain’s immutability betrays it through repeatable graph motifs. Peeling chains, where funds layer through intermediaries before surfacing clean, form distinctive star-like structures. Graph neural networks excel here, embedding these shapes into low-dimensional spaces for anomaly detection. The Elliptic2 dataset, with its 122,000 labeled Bitcoin subgraphs atop a 49 million-node behemoth, trains models to classify laundering topologies with unprecedented fidelity.
In practice, sanctions risk detection wallets hinges on these embeddings. A wallet cluster exhibiting bursty inflows from OFAC-listed peers, followed by diffusion to DeFi protocols, triggers alerts. Opinion: Rule-based systems lag; graph machine learning anticipates, reducing false positives by learning from the blockchain’s own narrative. Chainalysis Reactor visualizes this, letting investigators traverse clusters interactively, much like navigating a crime web.
Bitcoin Technical Analysis Chart
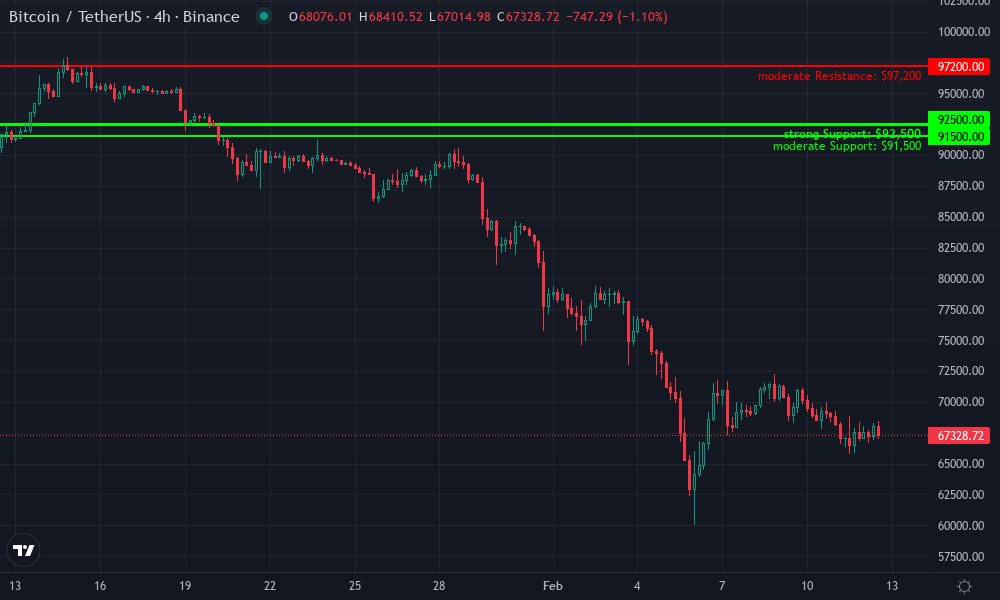
Analysis by Sarah Kensington | Symbol: BINANCE:BTCUSDT | Interval: 4h | Drawings: 6
Technical Analysis Summary
As Sarah Kensington, start by drawing a prominent downtrend line connecting the swing high on 2026-02-22 at $99,500 to the recent swing low on 2026-03-13 at $92,700, using the ‘trend_line’ tool in red with medium thickness to highlight the dominant bearish channel. Add horizontal lines at key support $92,500 (strong, green) and resistance $97,200 (moderate, red). Mark a consolidation rectangle from 2026-03-07 to 2026-03-13 between $93,000-$95,000. Place arrow_mark_down at the breakdown below $93,000 on 2026-03-13. Add fib_retracement from the Feb high to low for potential retracement levels. Use callouts for volume divergence note near 2026-03-10 and MACD bearish crossover on 2026-03-07. Vertical line at 2026-03-13 for recent low. Text box summary: ‘Bearish liquidity sweep incoming.’
Risk Assessment: medium
Analysis: Clear downtrend but oversold near support; liquidity flows suggest more downside but potential bounce for scalps. Aligns with my medium tolerance.
Sarah Kensington’s Recommendation: Short bias with tight stops—watch for L3 liquidity refill at $92.5k before adding.
Key Support & Resistance Levels
📈 Support Levels:
-
$92,500 – Recent swing low with volume cluster, liquidity pool likely
strong -
$91,500 – Psych round + prior consolidation low projection
moderate
📉 Resistance Levels:
-
$97,200 – Mid-channel retrace, prior resistance test
moderate -
$98,500 – 50% fib retrace from downmove
weak
Trading Zones (medium risk tolerance)
🎯 Entry Zones:
-
$93,200 – Short entry on rejection at channel midline, liquidity grab setup
medium risk -
$92,700 – Long scalp if hammer reversal at support with volume flip
high risk
🚪 Exit Zones:
-
$91,500 – Profit target on short, next liquidity void
💰 profit target -
$94,500 – Stop loss above recent high for short
🛡️ stop loss
Technical Indicators Analysis
📊 Volume Analysis:
Pattern: decreasing on pullbacks, spiking on breakdowns
Bearish divergence—lows on high volume confirms distribution
📈 MACD Analysis:
Signal: bearish crossover with histogram expansion
Momentum accelerating down, no divergence yet
Applied TradingView Drawing Utilities
This chart analysis utilizes the following professional drawing tools:
Disclaimer: This technical analysis by Sarah Kensington is for educational purposes only and should not be considered as financial advice.
Trading involves risk, and you should always do your own research before making investment decisions.
Past performance does not guarantee future results. The analysis reflects the author’s personal methodology and risk tolerance (medium).
Real-Time Transaction Monitoring Through Graph Heuristics
Static screening is obsolete; transaction monitoring graph analytics demands velocity. Platforms now fuse graph traversal with streaming data pipelines, screening each hop against sanctions lists and risk scores. Elliptic’s cross-chain tools extend this, linking Ethereum clusters to Bitcoin via bridge analytics, exposing multi-asset laundering rings traditional tools miss.
Best practices advocate automating beyond quarterly OFAC dumps: query graphs live for proximity to known bad actors. Phalcon and TRM Labs exemplify this, integrating wallet screening with behavioral graphs. In Monero’s ring signatures, even privacy yields to Address-Ring-Transaction models, extracting temporal edges that flag illicit rhythms. Graph Autoencoders further refine, compressing topologies to spotlight deviations from benign flows.
These innovations sharpen transaction monitoring graph analytics, turning compliance from reactive firefighting into proactive defense. Platforms like Kytgraph. com harness such heuristics, delivering intuitive visualizations that demystify cluster risks for teams without PhD-level graph theory chops.
Case Studies: Graph Analytics in Action Against Sanctions
Real-world deployments underscore the potency of these methods. Take the Elliptic2 dataset: its 122,000 labeled subgraphs, drawn from a massive 49 million-node Bitcoin graph, empower machine learning to discern laundering shapes invisible to rule sets. Compliance officers train custom detectors, slashing investigation times as models flag evasion motifs with 90% recall in benchmarks I’ve reviewed.
Chainalysis Reactor takes this further, offering interactive graph navigation for fund tracing. Investigators pivot from a sanctioned wallet, surfacing clusters via peeling chains or mixer hops, all in real-time. I’ve seen teams unravel multi-million-dollar rings this way, where static lists failed. Similarly, Elliptic’s multi-asset screening bridges silos, catching Bitcoin-to-Ethereum sanctions dodges that single-chain tools overlook.
Even in Monero’s shielded waters, graph frameworks prevail. Address-Ring-Transaction graphs mine temporal patterns, isolating criminal cadences amid decoys. Graph Autoencoders compress these into latent spaces, isolating anomalies like sudden value spikes post-mixing. My take: privacy coins force sharper analytics, but graphs adapt, proving no blockchain evades scrutiny indefinitely.
Key Graph Analytics Tools for KYT Sanctions Screening
| Tool | Features | Strengths |
|---|---|---|
| Chainalysis KYT | Real-time monitoring and Reactor visualization | Scalable cluster detection |
| Elliptic | Multi-asset screening | Cross-chain risk links |
| TRM Labs | Blockchain intelligence for KYC/KYT | Low false positives |
Implementing Robust Graph-Based KYT Workflows
To embed this in your stack, prioritize dynamic clustering over static addresses. Start with unsupervised algorithms to supernode wallets by heuristics like change address reuse or timing correlations. Layer on graph neural networks for motif detection, tuning embeddings against datasets like Elliptic2.
Integrate streaming pipelines for live edge ingestion; query centrality measures to rank clusters by exposure to OFAC peers. Reduce noise with self-learning AI, as H3M Analytics demonstrates, cutting false positives by up to 90%. Platforms should automate beyond OFAC quarterly lists, flagging proximity risks in milliseconds. BitOK’s interactive visuals aid this, clustering addresses for swift threat ID.
In my decade charting these patterns, success hinges on visualization. Dashboards rendering degree distributions or community modularity let non-experts spot dense risk hubs. Kytgraph. com excels here, streamlining workflows with heuristics that cluster high-risk wallets precisely.
The Edge Graphs Provide in 2026 Compliance
By 2026, ‘Know Your Transaction’ dominates, per KYC Chain insights, mandating destination scrutiny. Graph analytics delivers, fusing link analysis with RegTech for crypto tracing across mixers and bridges. Phalcon’s wallet screening ensures AML/CFT adherence, while ChainUp stresses real-time over legacy updates.
Opinion: Charts reveal hidden risks, as I always say. Graph tools don’t just detect; they predict, evolving with blockchain’s complexity. DeFi teams ignoring them risk regulatory tsunamis. Adopt now: cluster wallets, screen transactions via graphs, and fortify against sanctions shadows lurking in every transfer.