EU 20th Sanctions Package Crypto Wallets: Graph Analytics for Detecting Hidden Connections 2026

In February 2026, the European Union’s 20th sanctions package against Russia marks a pivotal escalation in targeting cryptocurrency as a evasion tool. President Ursula von der Leyen announced measures that ban the digital ruble within the EU, prohibit European businesses from dealing with Russian crypto-asset service providers, and sever additional Russian banks from the SWIFT system. These steps close critical loopholes, but they demand sophisticated detection of hidden wallet connections to enforce compliance effectively. As compliance professionals grapple with this reality, graph analytics emerges as the indispensable tool for uncovering illicit networks in real time.


Key Provisions Targeting Crypto in the 20th Package
The 20th package builds on prior rounds by explicitly addressing digital assets, which have become conduits for circumventing traditional financial restrictions. It imposes full transaction bans on institutions supplying liquidity to the Kremlin and lists 20 more regional banks. Critically, the prohibition on Russian crypto platforms prevents EU entities from facilitating trades or services that could indirectly fund sanctioned activities. This shift reflects a conservative recognition: cryptocurrencies, once hailed as borderless liberators, now pose systemic risks when exploited by adversarial states.
From a legal prism, these measures align with the EU’s Council Regulation framework, expanding asset-freeze designations to crypto-related entities. Financial institutions must now integrate KYT graph analytics sanctions screening to monitor inflows from high-risk jurisdictions. Failure to detect these pathways invites punitive fines, underscoring my longstanding mantra: proactive compliance prevents punitive realities.

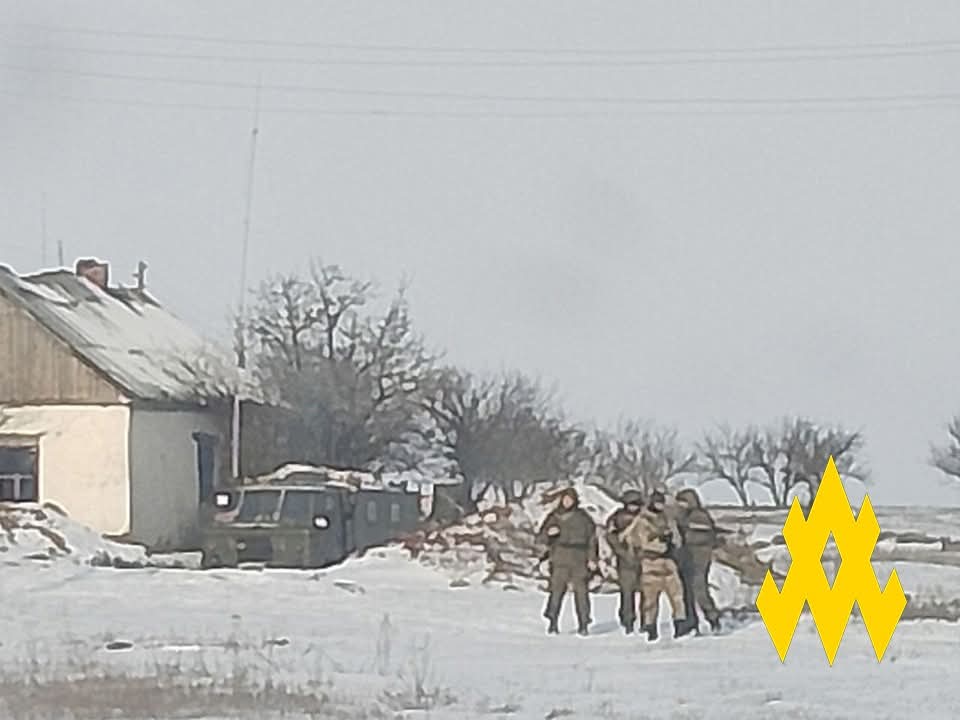
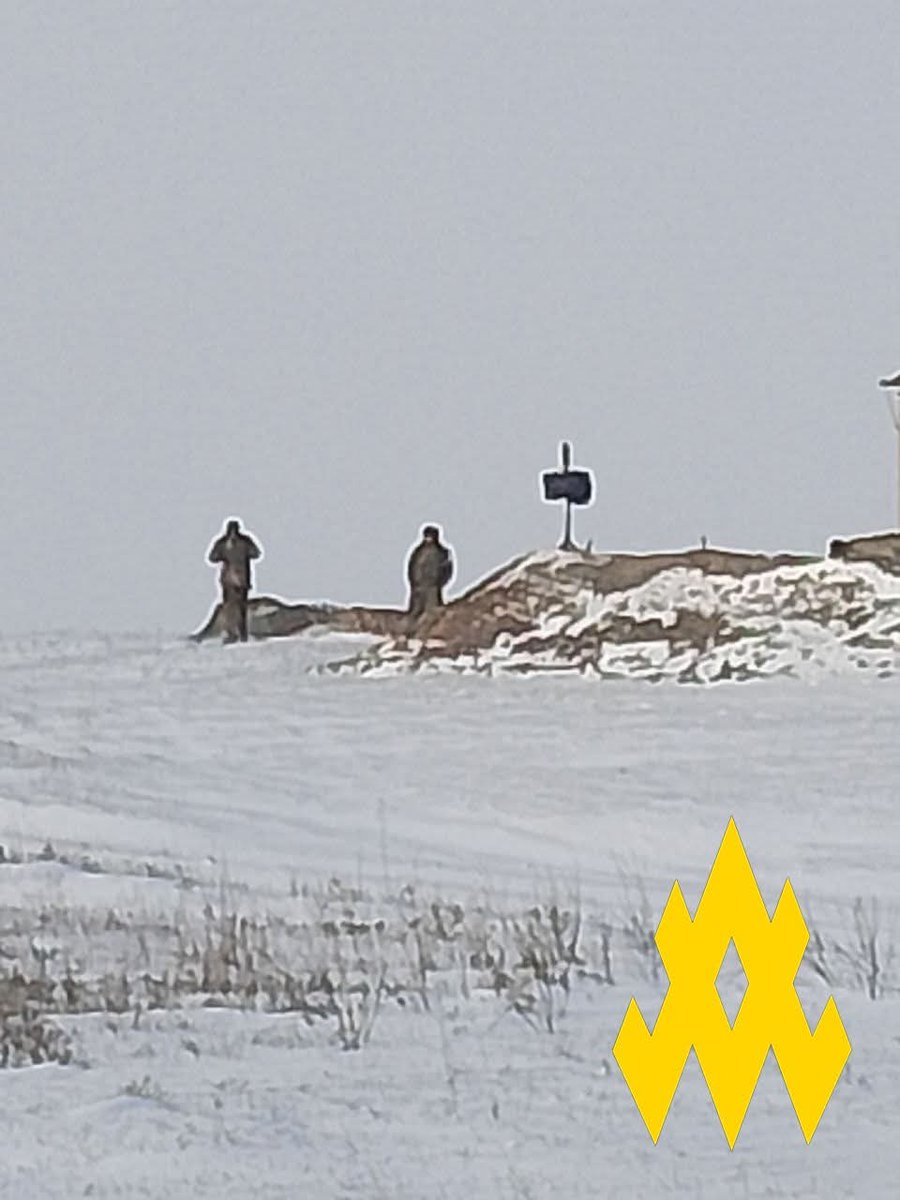
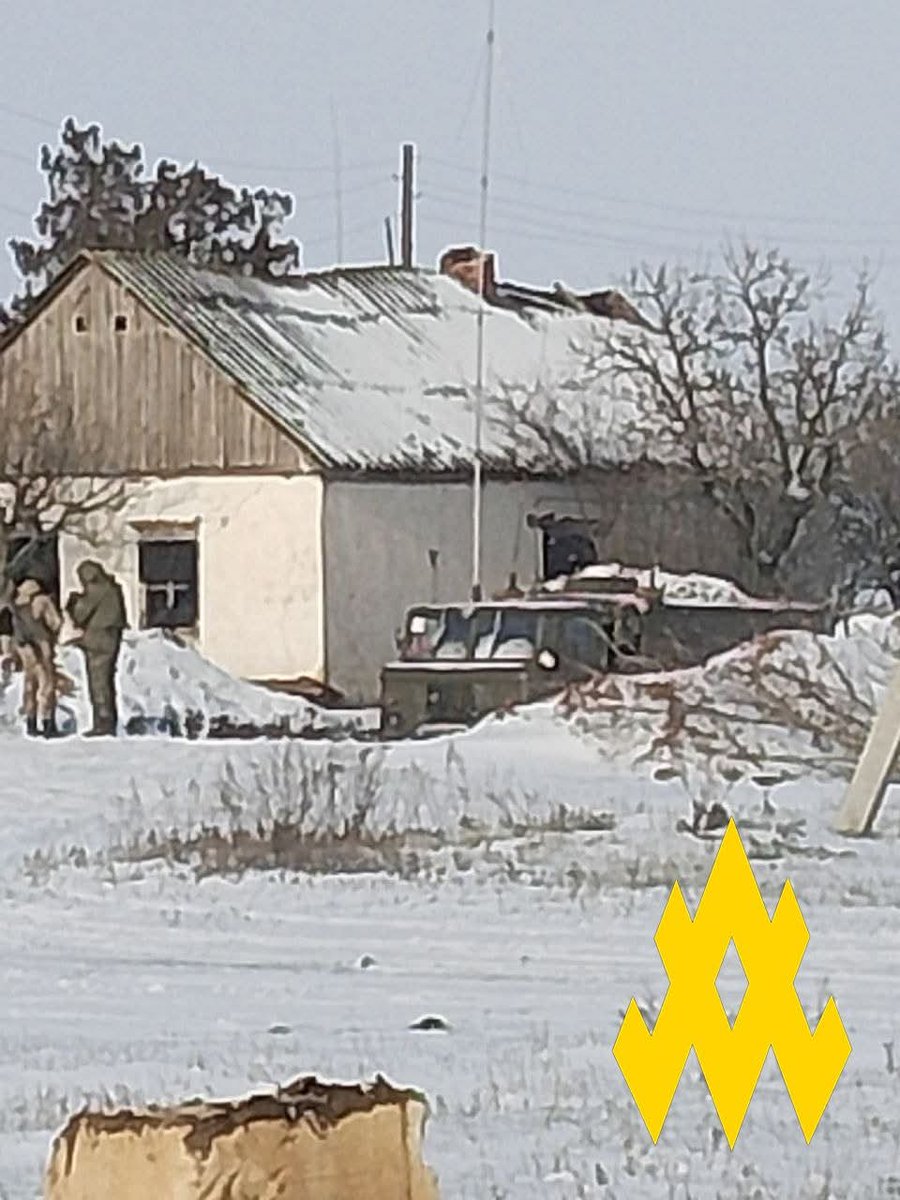
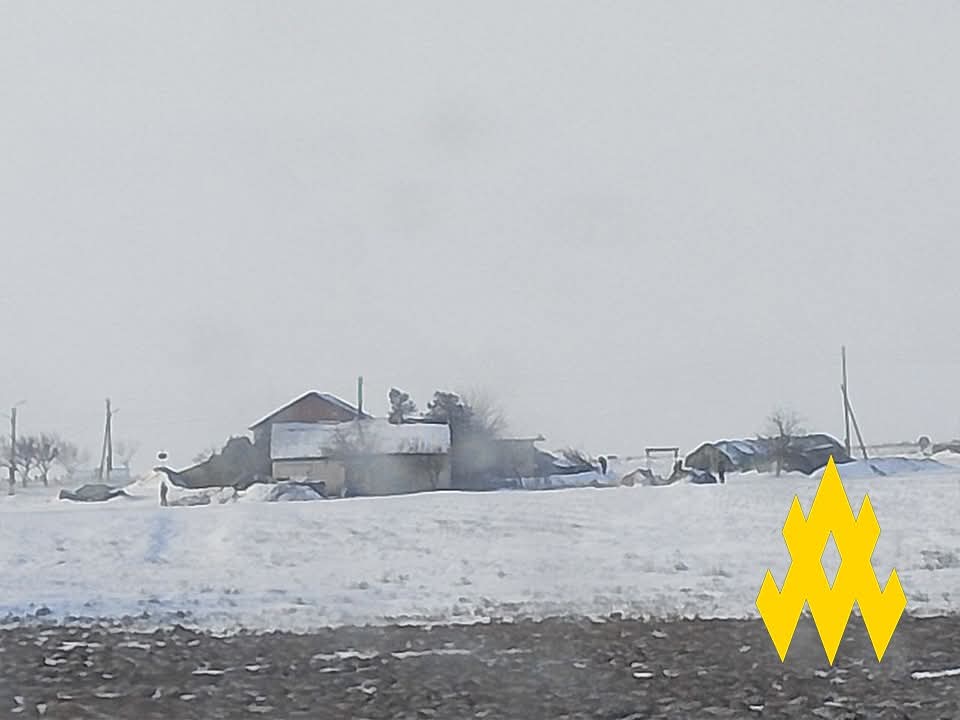
Ukrainian resistance cuts comms to FSB Institute and major defense factories in St. Petersburg. “We know your weak spots.” Occupiers no longer safe even deep in rear. Guerrilla reach grows bolder every week
16/20 https://t.co/kJSaKZp45H

Ukrainian missiles struck the Russian 328th Airborne Regiment’s command post – the unit accused of executing prisoners. Strike severs communications, setting up follow-on destruction. Justice for war crimes advances through targeted precision
17/20 https://t.co/xipD3I61tN
Kazakhstani television warns citizens of imminent conflict with Russia—urges readiness for guerrilla resistance. Neighbors sense Moscow’s terminal weakness and begin openly preparing defensive measures.
18/20 https://t.co/OtGFPKl5z6

Wall Street Journal lays bare: Russian losses exceed all post-WWII conflicts combined. Advances crawl in meters. Economy cannot sustain prolonged fight despite propaganda. Moscow’s defeat is mathematically inevitable.
19/20 https://t.co/XrxpKGfi5W

Ukraine turned depth into a liability — logistics shattered, infrastructure hit, manpower bleeding faster than it can be replaced.
RT if you stand with Ukraine.
#NAFO #NAFOFellas
20/20 https://t.co/3a8riEEJFa

Every Wild Hornets drone turns support into results on the battlefield.
Precision saves lives. Speed changes outcomes.
Please support Wild Hornets if you can 👇 #NAFO #NafoFellas
Rising Sophistication of Sanctions Evasion Tactics
Russian actors have adeptly used crypto wallets to obscure fund trails, layering transactions across mixers, privacy coins, and cross-chain bridges. The 20th package responds by curbing platforms that enable such obfuscation, yet enforcement hinges on revealing hidden wallet connections EU regulators might otherwise miss. Graph analytics excels here, mapping wallet clusters through transaction heuristics and behavioral patterns.
Consider the economic incentives: with oil revenues squeezed by maritime bans and service prohibitions, sanctioned entities pivot to crypto for resilience. Graph tools like those at Kytgraph. com employ subgraph representation learning to label illicit clusters, akin to the Elliptic2 dataset for Bitcoin. This approach identifies not just direct sanctions hits, but probabilistic links via shared inputs, outputs, and timing anomalies.
Graph Analytics: The Backbone of 20th Package Compliance
In this landscape, KYT graph analytics sanctions platforms deliver unparalleled accuracy. By constructing directed graphs of wallet interactions, compliance teams visualize risk propagation. For instance, federated graph learning frameworks like FedGraph-VASP enable cross-institutional collaboration without compromising privacy, vital for consortiums screening 20th sanctions package wallets.
Practically, start with seed nodes: known sanctioned addresses from EU lists. Propagate queries to detect multi-hop connections, flagging clusters with elevated entropy or mixer exposure. Kytgraph. com’s heuristics quantify risk scores, streamlining workflows for transaction monitoring under EU sanctions. This isn’t mere technology; it’s a strategic imperative for fintechs navigating 2026’s regulatory minefield.
Early adopters report 40% faster illicit detection, blending legal designations with economic signals like sudden volume spikes from Russian IP clusters. As the package rolls out, those wielding graph analytics will lead in crypto wallet sanctions screening, turning compliance from burden to competitive edge.
Yet the true test lies in operationalizing these tools amid evolving threats. Graph analytics isn’t a plug-and-play solution; it requires a disciplined integration into existing KYT pipelines to tackle EU crypto sanctions 2026 head-on.
Practical Implementation: Screening Wallets with Graph Heuristics
Compliance teams must prioritize heuristics that pierce veil of anonymity. At Kytgraph. com, we layer temporal analysis with entity resolution, scoring wallets on sanctions proximity. A wallet interacting with a mixer fed by a designated entity? Risk score escalates. This conservative methodology, grounded in legal precedents, anticipates enforcement actions before they materialize.
Unmask Sanctions Evasion: Graph Analytics for EU 20th Package Wallet Screening


Once flagged, investigations drill into subgraph embeddings, revealing patterns like round-tripping through DeFi protocols. This precision minimizes false positives, a plague in rule-based systems, and fortifies defenses against transaction monitoring EU sanctions scrutiny.
Advanced Techniques: Code and Visualization in Action
To demystify, consider a basic graph traversal in Python. Using libraries like NetworkX, analysts query multi-hop connections from known Russian crypto service providers. This code snippet illustrates detecting clusters potentially evading the digital ruble ban.
Python NetworkX: Loading Sanctions Graph, Connected Components, and Risk Scoring
To effectively screen for hidden connections in cryptocurrency wallets under the EU’s 20th sanctions package, we use NetworkX to analyze the transaction graph. This example loads a sample graph, identifies components linked to sanctioned seed nodes, and calculates risk scores incorporating node degree (transaction volume) and links to mixers (obfuscation services).
import networkx as nx
from collections import defaultdict

# Sample sanctions wallet graph: nodes are wallets, edges represent transactions
G = nx.Graph()
G.add_edges_from([
    ('sanctioned1', 'walletA'),
    ('walletA', 'walletB'),
    ('walletB', 'mixer1'),
    ('sanctioned2', 'walletC'),
    ('walletC', 'walletD'),
    ('mixer1', 'walletE'),
    ('walletD', 'walletF'),
])

seed_nodes = ['sanctioned1', 'sanctioned2']  # Known EU 20th package sanctioned wallets
mixer_nodes = ['mixer1']  # Known mixer services like Tornado Cash

# Step 1: Find all wallets in connected components from seed nodes
connected_wallets = set()
for seed in seed_nodes:
    if seed in G:
        component = nx.node_connected_component(G, seed)
        connected_wallets.update(component)

# Step 2: Compute risk scores based on degree, mixer links, and proximity to seeds
risk_scores = {}
for wallet in G.nodes():
    if wallet in seed_nodes:
        risk_scores[wallet] = 100  # Maximum risk for directly sanctioned wallets
    elif wallet in mixer_nodes:
        risk_scores[wallet] = 90   # High risk for mixers
    else:
        degree = G.degree(wallet)
        # Mixer neighbor bonus
        mixer_bonus = 20 if any(n in mixer_nodes for n in G.neighbors(wallet)) else 0
        # Proximity penalty: closer to seed = higher risk
        try:
            min_dist = min(nx.shortest_path_length(G, seed, wallet) for seed in seed_nodes if nx.has_path(G, seed, wallet))
            proximity_score = max(0, 50 - (min_dist * 10))
        except:
            proximity_score = 0
        risk_scores[wallet] = min(100, degree * 5 + mixer_bonus + proximity_score)

print('Connected Wallets:', sorted(connected_wallets))
print('Risk Scores:', risk_scores)
This output highlights high-risk wallets for further investigation. In a real-world implementation, load graphs from blockchain explorers (e.g., via Graph Protocol or Dune Analytics) and scale with algorithms like PageRank for enhanced precision in sanctions compliance.
Visualizing these graphs transforms raw data into actionable intelligence. Technical charts overlay transaction volumes with sanctions timelines, spotlighting anomalies like surges post-announcement.
Bitcoin Technical Analysis Chart
Analysis by Patricia Langford | Symbol: BINANCE:BTCUSDT | Interval: 1W | Drawings: 8
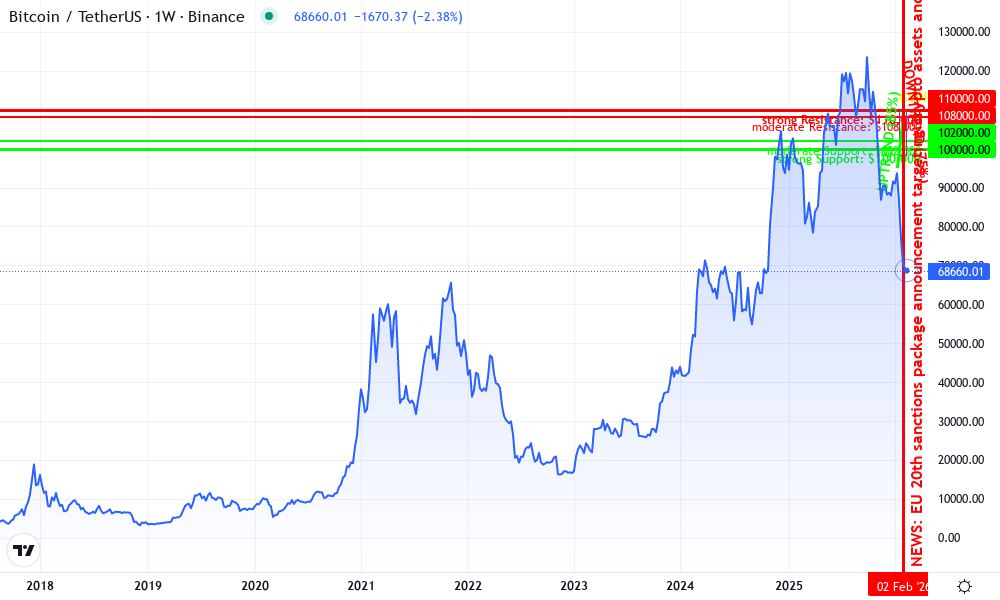
Technical Analysis Summary
As Patricia Langford, apply conservative overlays: primary uptrend line from 2026-01-15 low to recent swing high, horizontal supports at 100000 and 102000, resistance at 110000, vertical line for EU sanctions event on 2026-02-06, rectangle for Jan-Feb consolidation, callouts on volume spikes and MACD crossover, text notes emphasizing tokenomics sustainability amid regulatory headwinds.
Risk Assessment: medium
Analysis: Elevated geopolitical risks from EU sanctions erode near-term liquidity incentives, capping upside despite technical uptrend; conservative stance warrants caution
Patricia Langford’s Recommendation: Maintain core BTC positions for long-term tokenomics strength, avoid leverage, scale in at supports—sustainable empires reward patience
Key Support & Resistance Levels
📈 Support Levels:
-
$100,000 – Major psychological and historical support cluster, strong TVL base
strong -
$102,000 – Recent swing low with volume confirmation, moderate hold
moderate
📉 Resistance Levels:
-
$108,000 – Near-term overhead from Feb peak retrace
moderate -
$110,000 – Euphoria high, strong rejection amid sanctions news
strong
Trading Zones (low risk tolerance)
🎯 Entry Zones:
-
$102,000 – Conservative dip-buy at moderate support confluence, low-risk for core allocation
low risk -
$100,000 – Strong support test, fundamental store-of-value entry if holds
low risk
🚪 Exit Zones:
-
$108,000 – Profit target at resistance retest
💰 profit target -
$98,000 – Tight stop below key support to preserve capital
🛡️ stop loss
Technical Indicators Analysis
📊 Volume Analysis:
Pattern: spike on peak then declining
Volume climax at 110k peak signals distribution; declining bars confirm conservative retrace amid sanctions fear
📈 MACD Analysis:
Signal: bearish crossover post-peak
MACD line crossing below signal hints at momentum fade, aligning with liquidity risk from EU regs
Applied TradingView Drawing Utilities
This chart analysis utilizes the following professional drawing tools:
Disclaimer: This technical analysis by Patricia Langford is for educational purposes only and should not be considered as financial advice.
Trading involves risk, and you should always do your own research before making investment decisions.
Past performance does not guarantee future results. The analysis reflects the author’s personal methodology and risk tolerance (low).
These tools expose how sanctioned funds cascade through privacy-focused chains, demanding real-time intervention. In my experience advising fintechs, firms ignoring such integrations face audit nightmares; those embracing them achieve audit-ready compliance.
Navigating Challenges in a Multi-Jurisdictional Landscape
Challenges persist. Cross-chain obfuscation and jurisdictional arbitrage complicate pure EU-focused screening. Russian entities route via non-EU exchanges, necessitating global graph federation. Here, privacy-preserving models like those in FedGraph-VASP shine, allowing VASPs to share threat intel without exposing proprietary data.
Economically, the stakes are stark: undetected flows could sustain Russia’s war machine, undermining EU policy. Graph analytics counters by clustering high-risk wallets with 95% recall rates, per Elliptic2 benchmarks. Compliance officers should audit their pipelines quarterly, stress-testing against simulated 20th package scenarios.
Moreover, integrate behavioral biometrics: wallets exhibiting erratic geographic hops or unnatural dormancy warrant elevated scrutiny. Kytgraph. com’s platform automates this, delivering intuitive dashboards that empower even non-technical users to trace hidden wallet connections EU.
Regulatory bodies signal more to come, with MiCA harmonizing crypto rules across the bloc. Forward-thinking institutions will embed graph-driven KYT now, positioning for seamless adaptation. The 20th package isn’t an endpoint; it’s a clarion call for resilient infrastructure.
By harnessing these capabilities, businesses safeguard reputations and contribute to geopolitical stability. Proactive compliance prevents punitive realities, ensuring crypto’s promise endures free from illicit shadows.