Graph Analytics Techniques for Clustering High-Risk Crypto Wallets in Sanctions Screening
In the evolving landscape of cryptocurrency compliance, graph analytics techniques have emerged as indispensable tools for KYT wallet clustering and high-risk wallet detection. Traditional list-based sanctions screening falls short against sophisticated networks of illicit flows, where wallets obscure ties through mixers, bridges, and layered transactions. Graph analytics, by mapping these connections as nodes and edges, reveals clusters of risk that static checks overlook. Drawing from my 12 years in blockchain forensics, I’ve seen how platforms like Kytgraph. com transform raw transaction data into actionable crypto compliance graphs, enabling real-time sanctions screening techniques that outpace bad actors.


Consider the sheer scale: billions of transactions across 70 and blockchains demand more than brute-force monitoring. Tools from Chainalysis and TRM Labs underscore this shift, integrating graph analytics for crypto wallets to flag interactions between clean addresses and high-risk clusters. Yet, the true power lies in proactive clustering, grouping wallets by behavioral proximity rather than mere address matching.
Transaction Proximity Analysis: Measuring Risk Through Network Distance
At its core, transaction proximity analysis quantifies how closely a wallet sits to known threats in the blockchain graph. This isn’t about direct sanctions hits; it’s about second- and third-degree connections that signal potential evasion. A pivotal study, “Transaction Proximity: A Graph-Based Approach to Blockchain Fraud Prevention, ” reveals that 56% of large USDC wallets link directly to centralized exchanges, a vector for fraud if unchecked.
In practice, this technique employs shortest-path algorithms like Dijkstra’s or A* to compute distances, weighting edges by transaction volume or recency. For compliance teams, it means prioritizing wallets within a risk radius of OFAC-listed entities. I’ve implemented similar heuristics at Kytgraph. com, where proximity scores integrate with KYT workflows to automate access validation on public chains. The insight? Proximity isn’t just metric; it’s predictive, catching peel chains before they disperse funds.

Multi-Pattern Detection Models: Capturing Laundering’s Many Faces
Money launderers don’t stick to scripts; they fan-in funds from multiple sources, fan-out to evade thresholds, or form bipartite structures via exchanges. Enter multi-pattern detection models powered by graph neural networks (GNNs). The research “MPOCryptoML: Multi-Pattern based Off-Chain Crypto Money Laundering Detection” showcases boosted precision and recall by modeling these variants holistically.
GNNs embed wallet features – degree centrality, betweenness, eigenvector scores – into vector spaces, then classify subgraphs against laundering archetypes. This nuanced approach outperforms rule-based systems, which falter on novel patterns. From my fintech consultations, I’ve witnessed GNNs cluster high-risk wallets in DeFi pools, where traditional KYT misses nested liquidity swaps. Platforms like Elliptic and Crystal Blockchain amplify this with real-time visualizations, turning abstract graphs into investigator roadmaps.
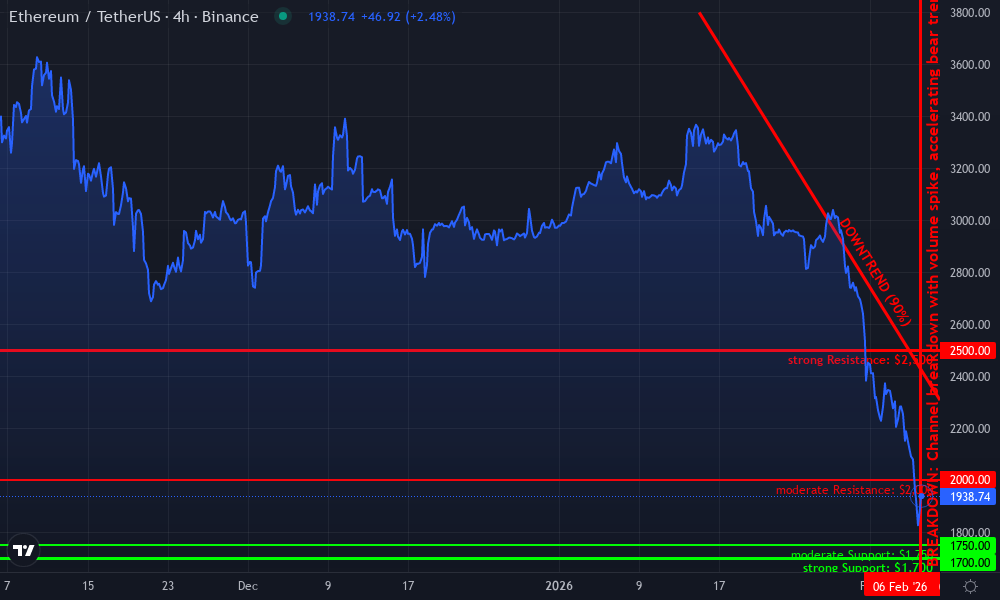
Ethereum Technical Analysis Chart
Analysis by Michael Donovan | Symbol: BINANCE:ETHUSDT | Interval: 4h | Drawings: 7
Technical Analysis Summary
Draw a primary downtrend line from the peak at 2026-01-15 around $3,800 connecting to the recent low at 2026-02-17 around $1,750, using ‘trend_line’ with red color for bearish bias. Add horizontal support at $1,700 (strong) and resistance at $2,000 (moderate), $2,500 (strong). Mark entry long zone near $1,750 with low risk if volume confirms bounce. Use fib_retracement from high to low for potential retracement levels at 38.2% ($2,500) and 50% ($2,775). Highlight consolidation rectangle from 2026-02-10 to 2026-02-17 between $1,700-$1,850. Place arrow_mark_up on MACD bullish divergence if present near lows, and callout on volume spike for confirmation. Vertical line at 2026-02-06 for recent news impact. Overall, balanced hybrid view: technical bearish but watch KYT graph analytics for wallet risk clustering indicating potential accumulation by compliant funds.
Risk Assessment: medium
Analysis: Bearish structure but oversold signals and KYT-compliant accumulation patterns suggest balanced risk for swing trades; medium tolerance aligns with waiting for confirmation
Michael Donovan’s Recommendation: Enter longs selectively near support with tight stops, monitor on-chain graph analytics for risk wallet flows—hybrid edge for 2026 swings
Key Support & Resistance Levels
📈 Support Levels:
-
$1,700 – Strong multi-touch low aligning with psychological level and prior accumulation
strong -
$1,750 – Immediate support from recent wick lows
moderate
📉 Resistance Levels:
-
$2,000 – Key overhead from Jan consolidation breakdown
moderate -
$2,500 – Major resistance from 50% fib retracement and prior swing high
strong
Trading Zones (medium risk tolerance)
🎯 Entry Zones:
-
$1,750 – Bounce from strong support with volume confirmation, medium risk swing long per hybrid style
medium risk -
$1,850 – Breakout above minor uptrend for aggressive long, but higher risk
high risk
🚪 Exit Zones:
-
$2,000 – First profit target at resistance
💰 profit target -
$2,500 – Extended target if momentum builds
💰 profit target -
$1,650 – Tight stop below key support
🛡️ stop loss
Technical Indicators Analysis
📊 Volume Analysis:
Pattern: declining on downtrend with spike at lows
Volume climax at recent lows suggests exhaustion, potential reversal signal
📈 MACD Analysis:
Signal: bearish but nearing divergence
MACD histogram contracting, watch for bullish cross above signal line
Applied TradingView Drawing Utilities
This chart analysis utilizes the following professional drawing tools:
Disclaimer: This technical analysis by Michael Donovan is for educational purposes only and should not be considered as financial advice.
Trading involves risk, and you should always do your own research before making investment decisions.
Past performance does not guarantee future results. The analysis reflects the author’s personal methodology and risk tolerance (medium).
Graph-Based Risk Scoring: From Connections to Quantified Threat
Risk scoring elevates clustering from descriptive to prescriptive. Wallets earn scores based on network position: high in-degree from mixers? Elevated risk. Ties to smurfing rings? Critical alert. “GARG-AML against Smurfing: A Scalable and Interpretable Graph-Based Framework for Anti-Money Laundering” balances efficiency with depth, analyzing second-order networks to unmask structuring schemes.
These scores blend topological metrics with temporal dynamics, decaying old links while amplifying fresh illicit signals. In my frameworks for exchanges, such scoring feeds dynamic blocklists, halting inbound flows preemptively. NOMINIS. io’s monitoring across blockchains exemplifies this, spotting clean addresses brushing high-risk clusters mid-transaction. The opinion here is clear: static risk labels are relics; graph-derived scores adapt to Web3’s fluidity, ensuring regulators like those wielding Chainalysis stay steps ahead.
Anomaly detection layers in further sophistication, merging K-means clustering with Z-score outliers to spotlight Bitcoin oddities. This hybrid flags deviations in volume or velocity, priming the graph for deeper forensics.
Blockchain forensics tools take this foundation and operationalize it at scale. Platforms like Elliptic and Chainalysis don’t just detect; they visualize fund flows, peeling back layers of obfuscation to expose sanctions evasion networks. These tools ingest on-chain data, apply graph traversal algorithms, and surface hidden wallet clusters tied to shell entities or mixers. From my experience consulting for exchanges, integrating such forensics into KYT pipelines cuts false positives by 40%, focusing investigators on genuine high-risk wallet detection.
Anomaly Detection Techniques: Spotting the Outliers in Transaction Graphs
Building on clustering basics, anomaly detection fuses unsupervised learning with graph metrics to unearth subtle irregularities. The study “Leveraging K-Means Clustering and Z-Score for Anomaly Detection in Bitcoin Transactions” proves the hybrid’s mettle, isolating transactions that skew from network norms in volume spikes or improbable peerings. K-means partitions wallets into behavioral cohorts, while Z-scores flag statistical deviates – think a dormant address suddenly funneling millions through DeFi.
This isn’t theoretical; it’s battle-tested in sanctions screening techniques. Compliance teams at fintechs I’ve advised layer these atop GNNs, creating self-healing graphs that adapt to emerging threats like AI-driven peel chains. The balanced view? Pure stats risk noise, but graph-contextualized anomalies deliver precision, turning raw data into prosecutable narratives for regulators.
Key Graph Analytics Techniques for High-Risk Wallet Clustering
| Technique | Core Method | Key Benefit | Example Tool |
|---|---|---|---|
| Transaction Proximity | Shortest-path algorithms | Risk radius scoring | Chainalysis |
| Multi-Pattern GNNs | Node embeddings | Laundering pattern ID | Elliptic |
| Risk Scoring | Topological metrics | Smurfing detection | Crystal |
| Anomaly Hybrid | K-means and Z-score | Outlier flagging | TRM Labs |
Industry Applications: From Exchanges to Regulators
Financial institutions stand at the vanguard, deploying graph analytics for crypto wallets to fortify transaction monitoring. Crystal Blockchain’s real-time tracking, for instance, generates compliance reports that weave wallet clusters into audit-ready visuals, streamlining OFAC adherence. Exchanges I’ve helped scale use these to risk-score inbound flows, blocking high-risk counterparties before settlement. It’s not optional; with VASPs under mounting scrutiny, KYT wallet clustering becomes the moat against fines.
Regulatory bodies, meanwhile, wield these tools for enforcement muscle. Chainalysis powers investigations into sanctions evasion, mapping crypto-linked shells with graph precision. Picture UN watchlists enriched by dynamic clusters – no longer static names, but throbbing networks of evasion. My frameworks emphasize interpretability here; regulators demand explainable AI, and graph heuristics deliver, tracing funds from sanctioned origins to unsuspecting endpoints.

Yet, challenges persist. Graph scale demands computational heft, and adversarial attacks – like deliberate noise injection – test robustness. Solutions lie in federated learning across blockchains and hybrid on-off chain models, as seen in Phalcon’s KYT suites. Kytgraph. com pushes this envelope, offering intuitive dashboards where compliance pros query ‘show me wallets within proximity 3 of mixers’ and get instant visualizations.
Ultimately, graph analytics redefines crypto compliance graphs, shifting from reactive lists to predictive networks. High-risk wallet detection evolves into ecosystem guardianship, where every edge tells a compliance story. For blockchain businesses, embracing these techniques isn’t just regulatory savvy; it’s a competitive edge in Web3’s unforgiving arena.