Streamlining Compliance Workflows with Crypto Wallet Graph Analytics

In the intricate world of cryptocurrency, where transactions pulse across blockchains at lightning speed, compliance teams face a daunting task: sifting through vast networks of wallets to uncover hidden risks. Traditional methods often falter, bogged down by manual reviews and fragmented data. Enter crypto wallet graph analytics, a transformative approach that maps connections with precision, enabling KYT workflow optimization and sharper sanctions compliance crypto strategies. At Kytgraph. com, we harness these tools to deliver clarity amid chaos, helping institutions navigate regulatory demands without compromising efficiency.


Graph analytics excels by representing wallets as nodes and transactions as edges, revealing patterns invisible to linear analysis. This methodology uncovers wallet clusters tied to sanctions lists or illicit flows, applying blockchain risk heuristics to flag anomalies in real time. Consider the sheer volume: billions of transactions across chains like Bitcoin and Ethereum demand more than spreadsheets; they require interconnected visualizations that highlight high-risk pathways.
Unveiling Hidden Connections in Transaction Networks
One of the most compelling strengths of graph-based systems lies in their ability to expose relationships that span multiple blockchains. Platforms akin to those from TRM Labs and Chainalysis demonstrate how intuitive workflows accelerate investigations, onboarding new chains swiftly while preserving analytical depth. For compliance professionals, this means tracing funds from a suspicious deposit through mixers and exchanges to their origins, often in minutes rather than hours.
Take Elliptic’s innovations, which automate risk scoring and cut analyst time dramatically. Similarly, tools from Nansen and Merkle Science map transaction flows graphically, pinpointing high-risk entities. In my two decades analyzing wallet data, I’ve seen how these heuristics evolve; they now incorporate machine learning to adapt to emerging threats, reducing false positives as promised by solutions like H3M Analytics.
Key Advantages of Graph Analytics for KYT
-
Faster Risk Detection: Enables rapid identification of risks, reducing investigation times from hours to minutes, as demonstrated by Elliptic’s copilot.
-

Multi-Chain Support: Handles transactions across numerous blockchains seamlessly, with platforms like Crystal Intelligence covering over 330 chains.
-

Reduced False Positives: Advanced graph techniques minimize alerts, cutting false positives by up to 90%, per H3M Analytics.
-
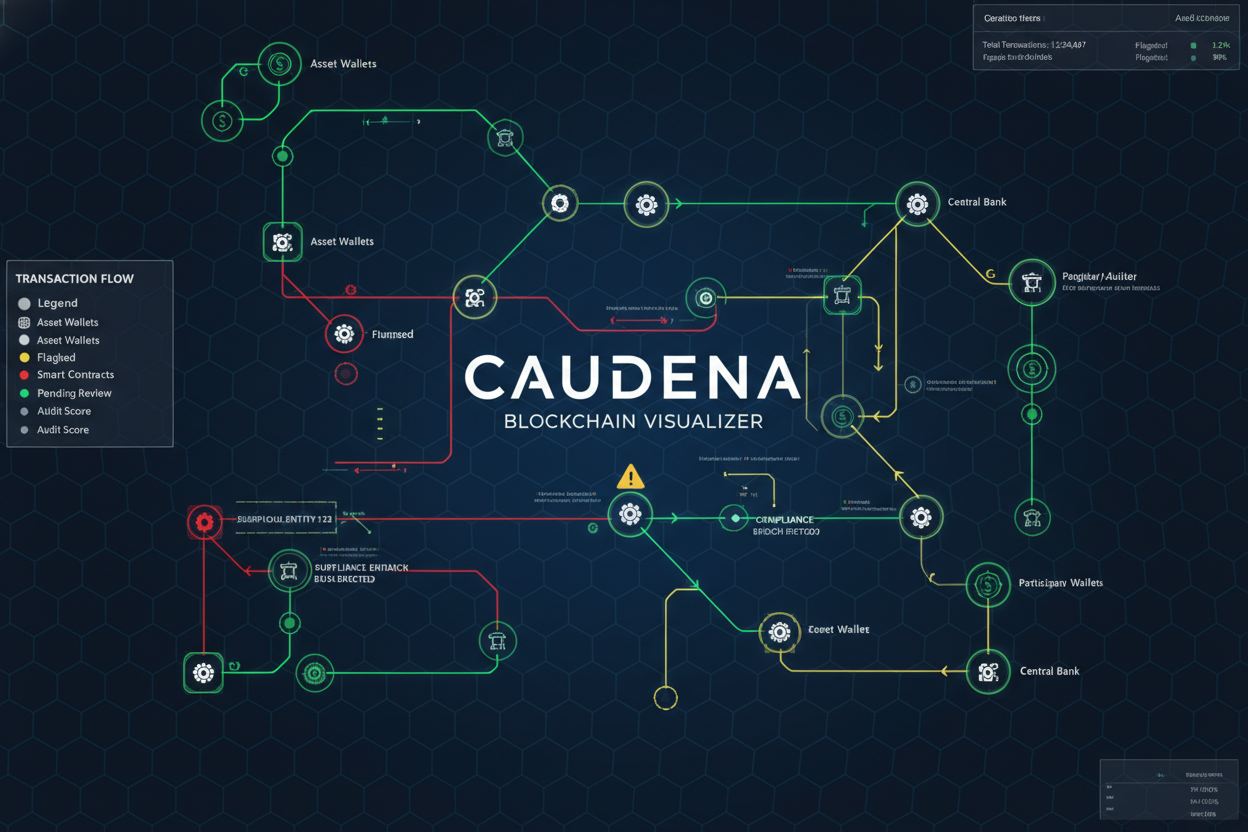
Intuitive Visualizations: Provides clear graphical mappings of transaction flows and wallet connections, aiding compliance teams as in Caudena tools.
-
Actionable Compliance Insights: Delivers verifiable reports and contextual intelligence, supporting AML obligations via tools from Chainalysis.
Real-World Impact on Sanctions Screening
When sanctions hit, the ripple effects through crypto ecosystems can destabilize portfolios. Graph analytics provide a conservative bulwark, clustering wallets linked to designated entities and forecasting exposure. BitOK’s Graph for Investigations, for instance, auto-highlights risks across chains, streamlining forensic workflows. Crystal Intelligence complements this with real-time monitoring over 330 blockchains, generating defensible reports rooted in verifiable evidence.
From a low-risk perspective, this integration is essential. Institutions using such platforms, much like those empowered by AnChain. AI for Big Four firms, report slashed investigation times. Academic frameworks, such as GraphCompliance, further validate this by aligning policy graphs with runtime contexts, easing regulatory interpretation at scale.
Optimizing Workflows for Regulatory Resilience
Building resilient compliance demands more than detection; it requires seamless workflows. KyrosAML’s unified platform, leveraging entity resolution and graph tech, consolidates data into timelines that sharpen context. Process Street automates KYC and AML processes, ensuring audit readiness without stifling innovation. Caudena’s graphical tools visualize multi-wallet suspicions, powered by LLMs for faster probes.
Lukka and MDPI research underscore the systemic benefits: from fraud detection to asset protection against sophisticated crime. In practice, this means compliance teams shift from reactive firefighting to proactive risk management, applying heuristics that weigh transaction velocity, peer groups, and sanctions proximity. Kytgraph. com embodies this ethos, offering visualizations that demystify complexities and empower decisions grounded in data integrity.
Institutions adopting these advanced crypto wallet graph analytics compliance tools report measurable gains in operational efficiency. Graph representations turn opaque transaction histories into navigable maps, where nodes pulse with risk scores derived from heuristics like unusual volume spikes or sanctioned peer associations. This shift allows teams to prioritize threats methodically, conserving resources for strategic oversight rather than exhaustive manual scrutiny.
Practical Steps for KYT Workflow Optimization
Transitioning to graph-driven compliance isn’t abstract; it follows a deliberate path suited to conservative risk profiles. Start by ingesting multi-chain data into a unified graph database, then layer on heuristics tailored to sanctions lists and known illicit actors. Visualization layers reveal clusters, prompting targeted investigations that align with regulatory expectations.
Streamlining KYT: Methodical Graph Analytics Integration


Once implemented, these systems excel in ongoing monitoring. Tools mirroring BitOK and Crystal Intelligence auto-tag risks, tracing cross-chain hops with evidentiary trails. For strategists like myself, this means forecasting sanctions impacts through historical wallet clusters, building portfolios resilient to regulatory shocks.
Quantifying Risk with Visual Analytics
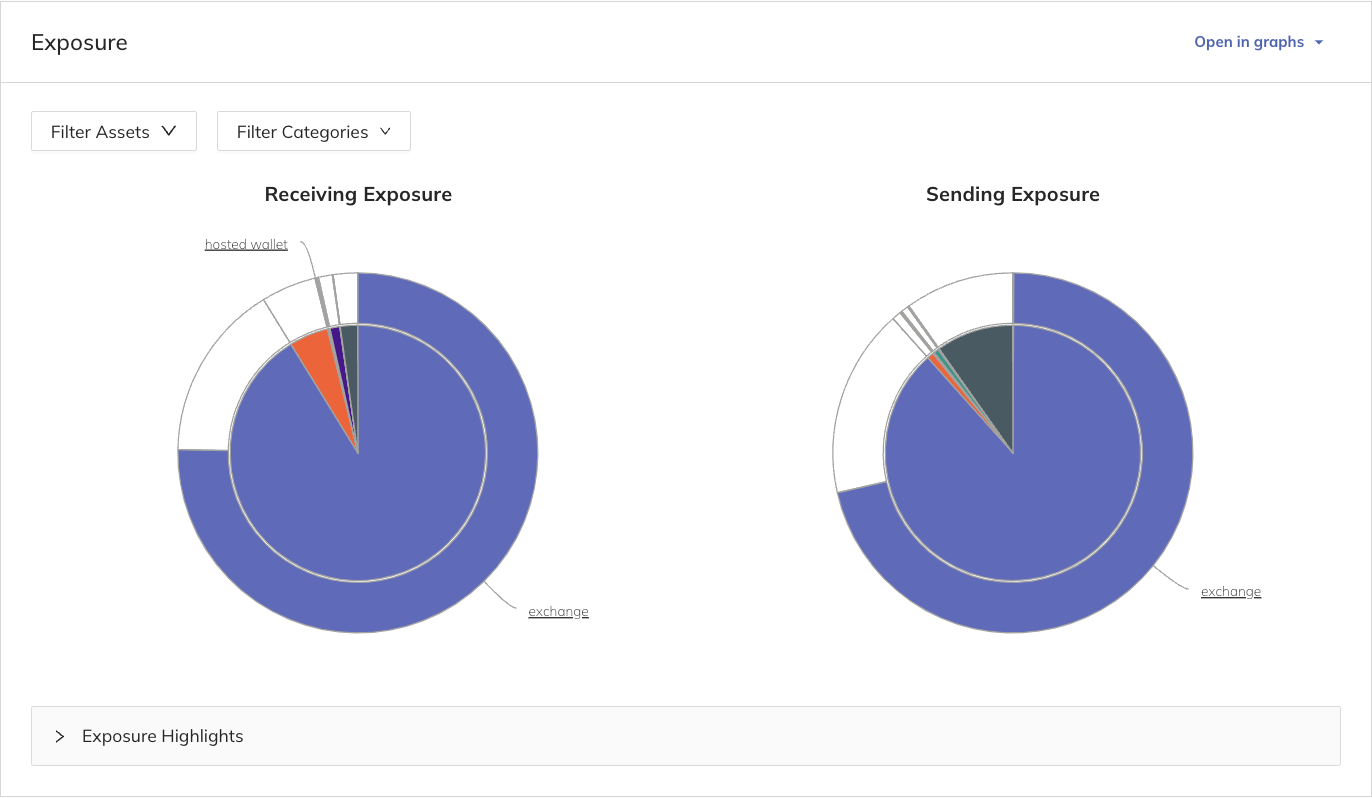
Visual prowess defines graph analytics’ edge. Interactive charts overlay transaction velocities against baseline norms, spotlighting deviations that signal money laundering or sanctions evasion. Nansen-style tools identify suspicious wallet clusters for reporting, while Merkle Science’s mappings expose high-risk entities in vivid detail.
Ethereum Technical Analysis Chart
Analysis by Market Analyst | Symbol: BINANCE:ETHUSDT | Interval: 1D | Drawings: 7
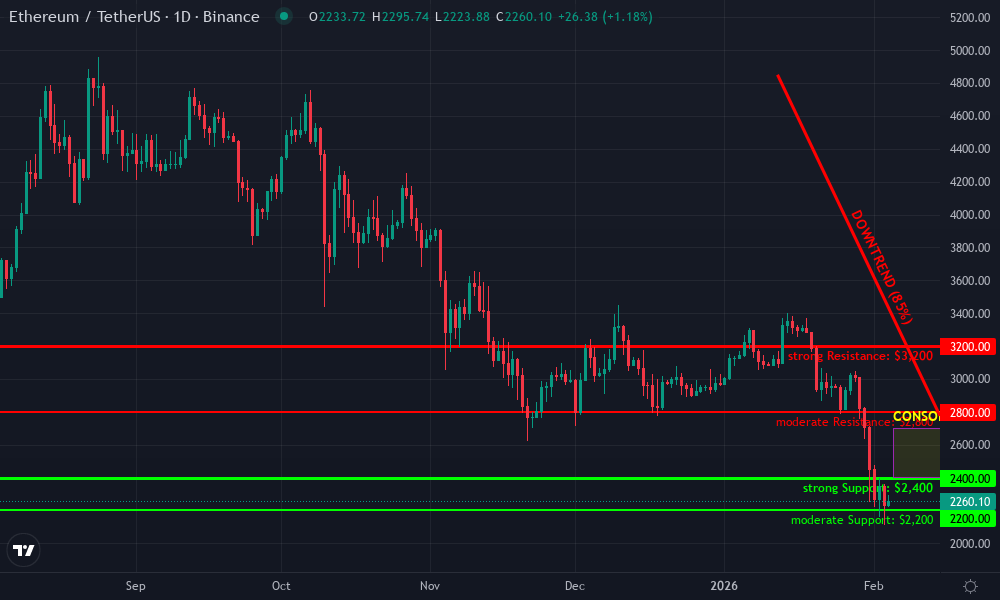
Technical Analysis Summary
As a seasoned technical analyst with 5 years of experience focusing on pure price action and key indicators, I recommend the following drawing setup on this ETHUSDT daily chart to highlight the bearish structure: 1. Draw a prominent downtrend line connecting the swing high at approximately 2026-01-12 around $4,850 to the recent lower high at 2026-02-10 around $3,200, extending to current levels near $2,450. Use trend_line tool. 2. Mark horizontal support at $2,400 (strong) and $2,200 (moderate) with horizontal_line. 3. Resistance horizontals at $2,800 and $3,200. 4. Rectangle for the recent consolidation range from 2026-02-05 to 2026-02-18 between $2,400-$2,700. 5. Long entry zone callout near $2,450 with low risk if volume picks up. 6. Arrow down on MACD bearish crossover around 2026-02-12. 7. Vertical line for recent breakdown below $2,700 on 2026-02-15. This setup captures the bearish momentum while spotting potential reversal zones in a balanced manner.
Risk Assessment: medium
Analysis: Bearish trend intact but signs of exhaustion at support; medium tolerance suits waiting for confirmation
Market Analyst’s Recommendation: Consider low-risk long entry near $2,450 support targeting $2,800, SL at $2,300. Avoid if breaks lower.
Key Support & Resistance Levels
📈 Support Levels:
-
$2,400 – Recent lows and psychological round number holding price
strong -
$2,200 – Prior swing low extension if breakdown occurs
moderate
📉 Resistance Levels:
-
$2,800 – Recent consolidation high, former minor support turned resistance
moderate -
$3,200 – Key horizontal from mid-Feb highs
strong
Trading Zones (medium risk tolerance)
🎯 Entry Zones:
-
$2,450 – Bounce from strong support with potential volume divergence
low risk -
$2,600 – Break above consolidation high for bullish confirmation
medium risk
🚪 Exit Zones:
-
$2,800 – First resistance target
💰 profit target -
$3,000 – Extended target if momentum builds
💰 profit target -
$2,300 – Below key support invalidates long
🛡️ stop loss
Technical Indicators Analysis
📊 Volume Analysis:
Pattern: decreasing on downside
Tapering volume suggests exhaustion, potential reversal setup
📈 MACD Analysis:
Signal: bearish crossover with possible divergence
MACD line below signal, histogram contracting—watch for bullish cross
Applied TradingView Drawing Utilities
This chart analysis utilizes the following professional drawing tools:
Disclaimer: This technical analysis by Market Analyst is for educational purposes only and should not be considered as financial advice.
Trading involves risk, and you should always do your own research before making investment decisions.
Past performance does not guarantee future results. The analysis reflects the author’s personal methodology and risk tolerance (medium).
Consider a hypothetical yet grounded scenario: a wallet cluster linked to OFAC-designated addresses emerges in your feed. Graph tools quantify exposure via edge weights representing flow volumes, enabling swift freezes or reports. This precision, honed by platforms like Caudena with LLM enhancements, minimizes overreach and bolsters defensibility.
Academic insights from MDPI and arXiv reinforce these outcomes. AI-augmented graphs streamline workflows, cutting false positives as H3M claims up to 90 percent. Elliptic’s copilot exemplifies automation’s role, compressing hours-long probes into minutes. TRM Labs’ rapid chain onboarding ensures coverage keeps pace with crypto’s expansion.

Yet success hinges on measured adoption. Overreliance on any single heuristic risks blind spots; instead, blend graph insights with human judgment. Kytgraph. com advocates this balance, delivering intuitive dashboards that cluster risks without overwhelming users. Financial institutions leveraging such platforms fortify their positions, turning compliance from a cost center into a competitive moat.
Institutional memory from past cycles teaches caution amid hype. Graph analytics, when conservatively applied, withstands scrutiny, supporting sanctions compliance crypto amid volatile regs. As blockchains proliferate, these tools will define workflow resilience, empowering professionals to safeguard ecosystems with foresight and fidelity.