Visualizing Hidden Wallet Connections in Crypto Transaction Monitoring

In today’s cryptocurrency landscape, with Bitcoin hovering at $76,019.00 following a $2,340.00 drop over the past 24 hours, the blockchain’s transparency unmasks transactions but cloaks wallet ownership. This duality breeds hidden connections that savvy actors exploit for sanctions evasion or money laundering. Mastering visualizing wallet connections crypto via graph analytics transforms raw data into actionable intelligence, fortifying KYT visualizations against these shadows.

Compliance professionals grapple with pseudonymous addresses linking to real-world risks. Tools from Chainalysis and Elliptic trace funds across chains, yet true power lies in graph-based mapping that reveals wallet clusters controlled by single entities. At Kytgraph. com, we deploy sophisticated heuristics to illuminate these networks, blending quantitative edge detection with regulatory nuance.
Graph Neural Networks as the Backbone of Detection
Graph Neural Networks (GNNs) treat wallet interactions like social graphs, pinpointing illicit clusters with precision. Medium analyses underscore how GNNs identify hidden criminal hubs, far surpassing linear transaction scans. Consider a mixer service funneling funds: isolated views miss the pattern, but GNNs propagate risk scores across nodes, flagging sanctions wallet graphs before they disperse.
Personalized PageRank, as in TRacer tools, amplifies this by weighting paths from known high-risk addresses. In account-based chains like Ethereum, it efficiently traces tumbling schemes, where funds bounce through proxies. Our hybrid models at Kytgraph. com integrate these, achieving sub-second queries on massive datasets without sacrificing depth.
Interactive Visualizations: From Data to Insight
SilkViser-style tools democratize analysis, offering intuitive interfaces for novices and pros alike. Interactive nodes expand to show inflows, outflows, and entity labels, turning terabytes into scannable maps. Transaction mapping converts ledgers into visual flows, easing fund tracing between wallets.
Cluster analysis takes it further, grouping addresses by behavioral fingerprints: velocity rules, stablecoin corridors, even DeFi hops. Qulix design patterns recommend layering sanctions checks atop these, catching velocity spikes indicative of layering. In practice, this uncovered a 2025 phishing ring via Transformer networks traversing Ethereum graphs, capturing nuanced interactions traditional rules ignored.
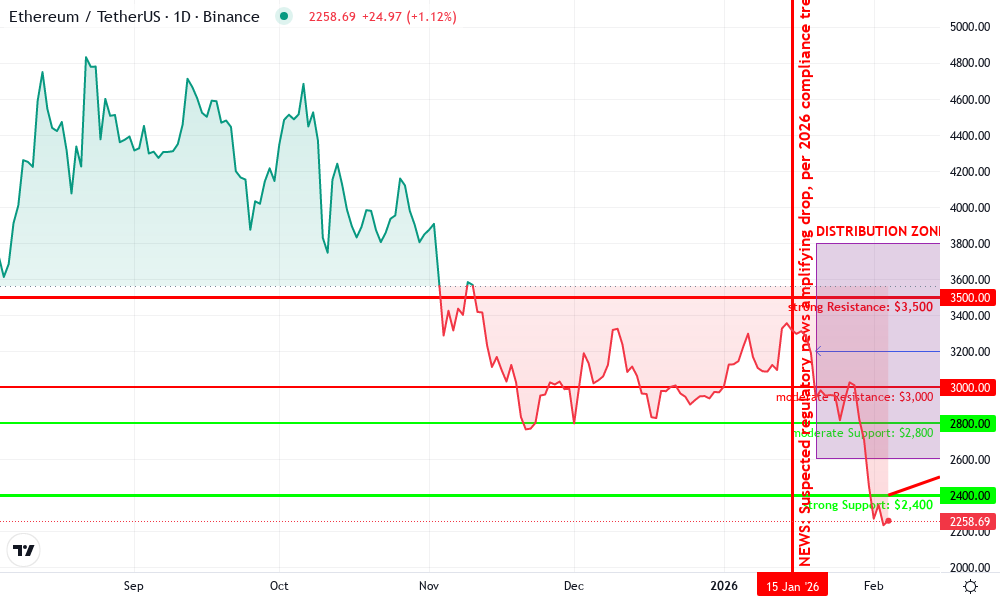
Ethereum Technical Analysis Chart
Analysis by David Harlan | Symbol: BINANCE:ETHUSDT | Interval: 1D | Drawings: 9
Technical Analysis Summary
As David Harlan, with my conservative hybrid approach blending technical patterns with KYT-driven risk overlays, I recommend drawing a primary downtrend line connecting the October 2026 high at approximately 4800 to the recent February low near 2400, using ‘trend_line’ tool. Add horizontal support at 2400 (strong) and resistance at 3000/3500. Mark volume spikes at the December drop with ‘arrow_mark_down’. Draw a potential accumulation range from late January to early February using ‘date_price_range’. Place callouts on MACD bearish divergence and a red rectangle over the ongoing downtrend zone for risk visualization. Use fib_retracement from the Oct high to Feb low for retracement levels at 38.2% (~3200) and 50% (~3600). Vertical lines at key KYT-relevant dates like 2026-01-15 for potential sanctions news impact.
Risk Assessment: high
Analysis: Persistent downtrend amid crypto KYT scrutiny elevates volatility; illicit graph links amplify downside risks per my FRM hybrid model
David Harlan’s Recommendation: Stay sidelined or scale short with <1% risk; monitor TRM/Chainalysis feeds for transaction clarity before any long bias
Key Support & Resistance Levels
📈 Support Levels:
-
$2,400 – Strong support at recent lows, potential KYT accumulation floor amid wallet clustering
strong -
$2,800 – Moderate interim support from Jan bounce
moderate
📉 Resistance Levels:
-
$3,000 – Key resistance from Dec lows, fib 23.6% retrace
moderate -
$3,500 – Stronger overhead from Nov structure, sanctions risk cap
strong
Trading Zones (low risk tolerance)
🎯 Entry Zones:
-
$2,450 – Dip buy near strong support if volume confirms reversal, low-risk hybrid entry with KYT screen
low risk -
$2,900 – Short entry on resistance rejection, conservative with tight stop
low risk
🚪 Exit Zones:
-
$2,200 – Stop loss below support for longs
🛡️ stop loss -
$3,000 – Profit target at resistance for shorts
💰 profit target
Technical Indicators Analysis
📊 Volume Analysis:
Pattern: Increasing on downside with spike at Dec drop, potential distribution
Volume climax suggests exhaustion, but watch for KYT illicit spikes
📈 MACD Analysis:
Signal: Bearish crossover persisting, histogram contracting
MACD divergence hints at weakening momentum, align with graph neural risk models
Applied TradingView Drawing Utilities
This chart analysis utilizes the following professional drawing tools:
Disclaimer: This technical analysis by David Harlan is for educational purposes only and should not be considered as financial advice.
Trading involves risk, and you should always do your own research before making investment decisions.
Past performance does not guarantee future results. The analysis reflects the author’s personal methodology and risk tolerance (low).
Collective Anomalies: Elevating User-Level Scrutiny
Shifting from address-centric to user-centric detection marks a pivotal evolution. MDPI research clusters multi-wallet users, boosting fraud detection by 25% in benchmarks. Anomalies emerge not in single hops but collective behaviors: synchronized inflows from exchanges followed by mixer outflows signal coordinated risk.
MetaSleuth and H3M’s Link Miner exemplify this, mapping networks to expose pseudonymous ties to real-world profiles. KYC Chain flips blockchain transparency into a compliance asset, assigning risk scores via source-of-funds graphs. For institutions embedding wallets, real-time KYT demands these layers: screen against OFAC lists, monitor peer groups, alert on emerging corridors.
Global Ledger’s AI alerts and TRM Labs’ intelligence power proactive blocks, yet visualization remains the linchpin. At Kytgraph. com, our platform renders these as dynamic graphs, empowering teams to drill into high-risk clusters with drag-and-drop ease. This isn’t mere monitoring; it’s predictive fortification against the crypto underworld’s ingenuity.
Elementus paradigms shift from static KYC to dynamic KYT, analyzing transactions in flight. Elliptic Navigator flags suspicious patterns, but graph depth distinguishes leaders. As Bitcoin stabilizes near $76,019.00, regulators intensify scrutiny; those wielding superior crypto transaction graph analytics will navigate compliance unscathed.