Graph Analytics Dashboards for Real-Time Crypto Wallet Sanctions Screening

In the volatile arena of cryptocurrency, where billions flow through decentralized networks every second, traditional compliance methods falter against sophisticated laundering schemes. Graph analytics dashboards for real-time crypto wallet sanctions screening emerge as the linchpin, transforming raw blockchain data into actionable intelligence. These tools map intricate wallet connections, spotlight high-risk clusters, and flag sanctions violations before funds settle, safeguarding institutions from regulatory pitfalls.


Regulatory bodies like OFAC intensify scrutiny on crypto, mandating robust KYT transaction monitoring. Unlike static KYC checks, KYT demands continuous surveillance of transaction flows. Graph analytics excel here, revealing hidden patterns; a single wallet might link to dozens of entities across chains, evading simple address screening. Platforms leveraging these dashboards cut through noise, delivering crypto compliance visualizations that compliance teams trust for decisions under pressure.
Unraveling Illicit Networks with Graph-Powered Insights
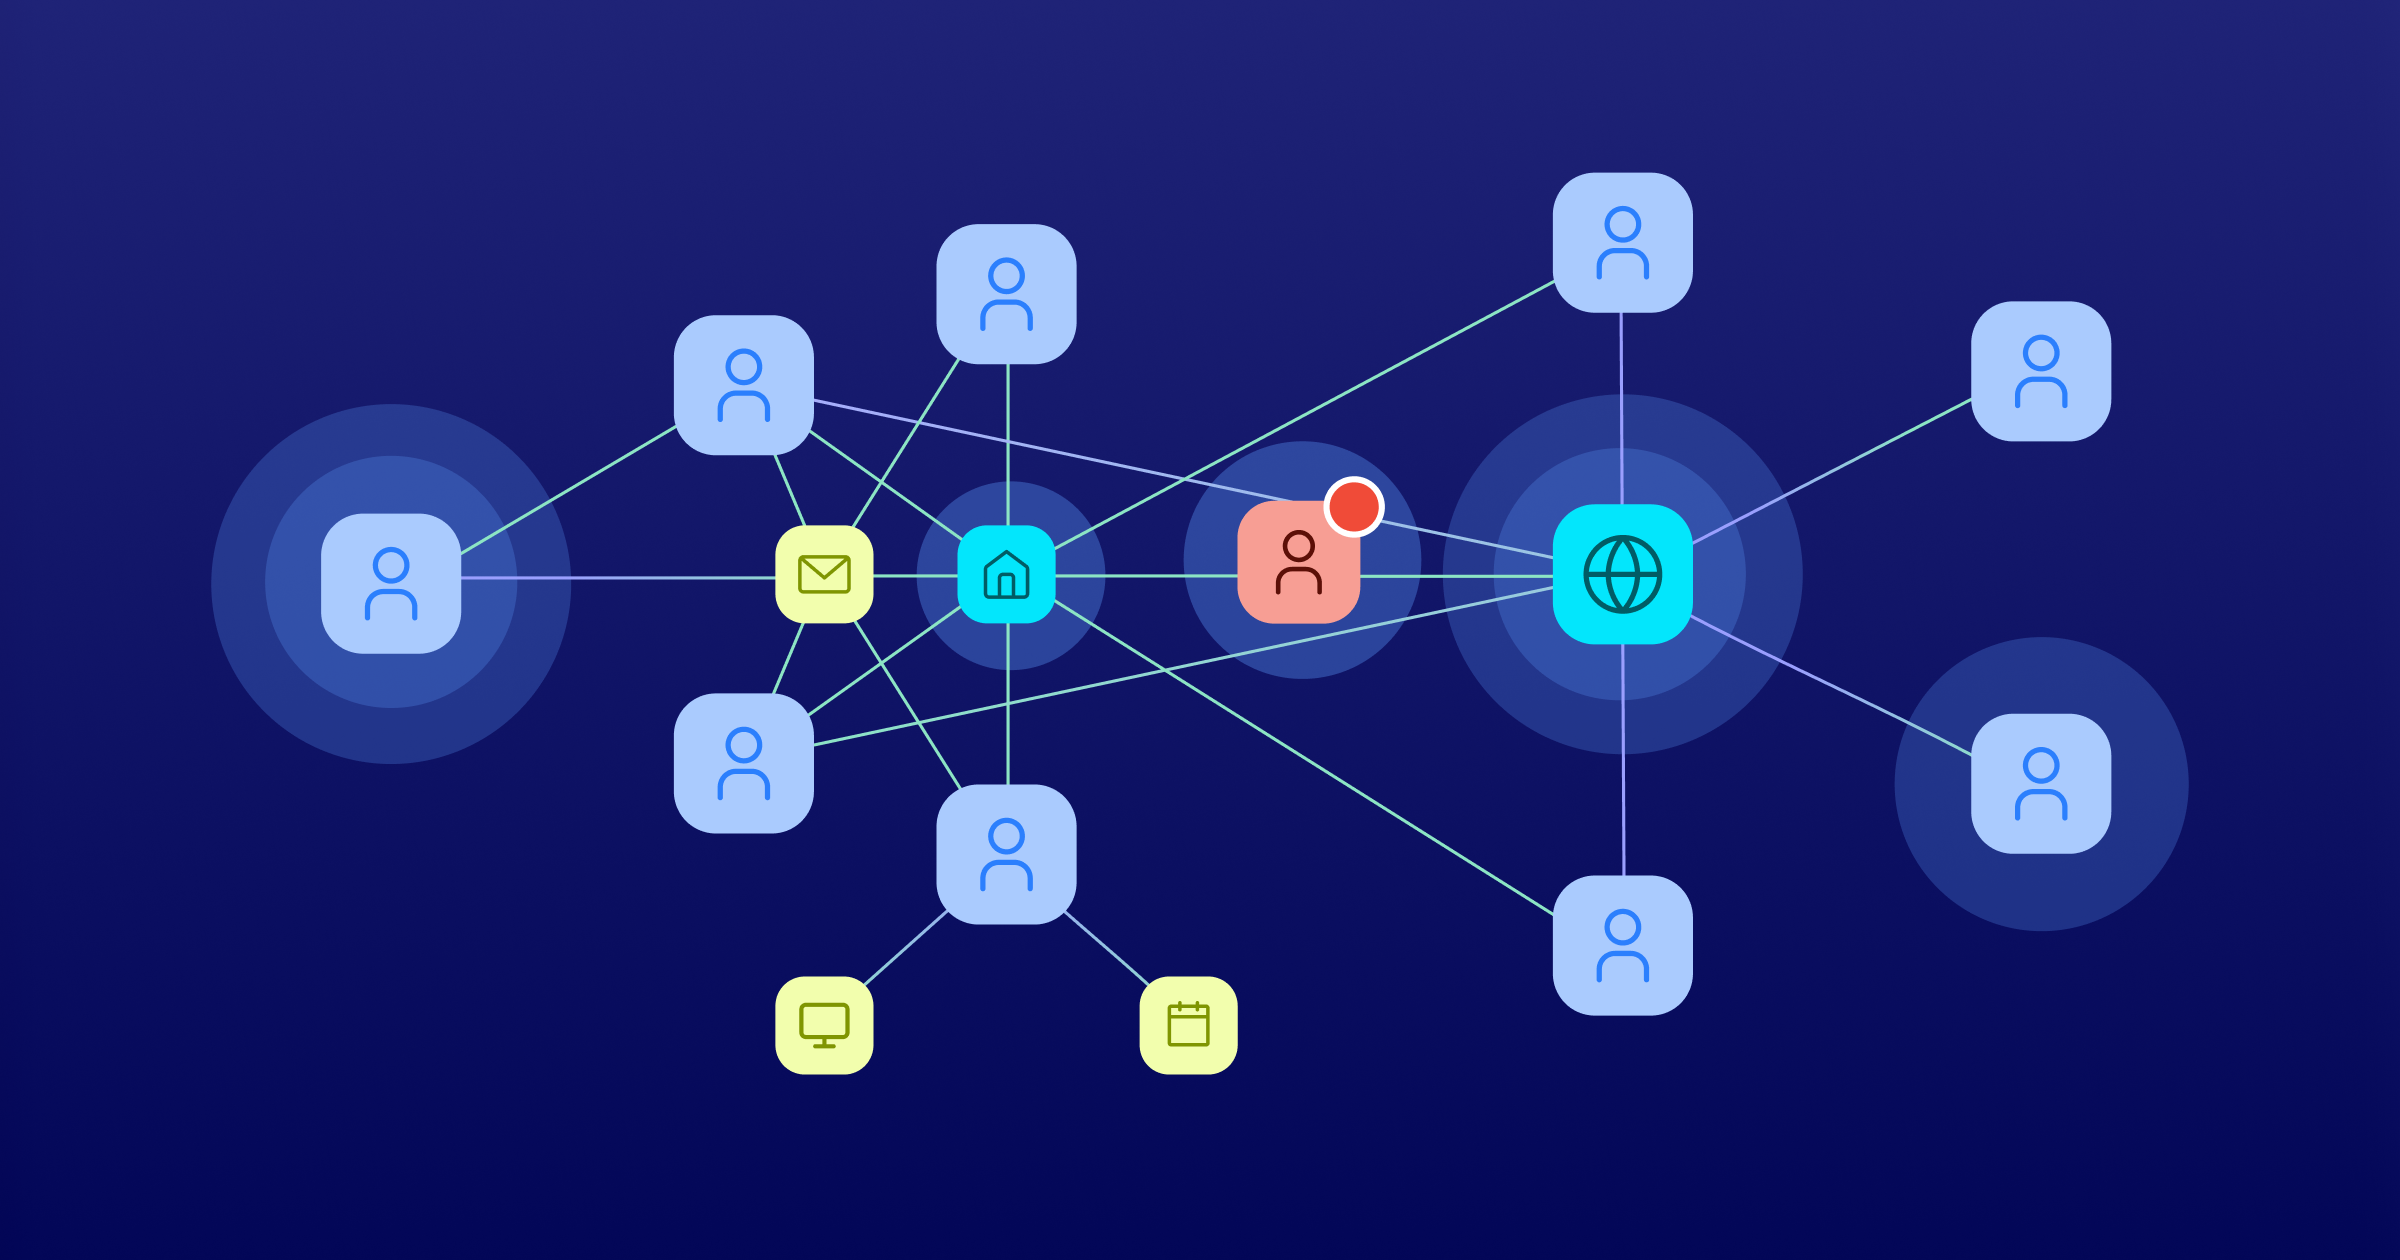
Picture a web of wallets: one touches a sanctioned entity, another funnels to darknet markets, yet surface-level scans miss the ties. Graph analytics dashboards dissect this by modeling transactions as nodes and edges, computing centrality measures to isolate influencers in risk propagation. Chainalysis underscores how KYT streamlines operations at scale, while TRM Labs highlights blockchain intelligence fueling real-time KYC and KYT. In practice, these dashboards deploy heuristics like peeling algorithms to cluster mixer usage or ransomware proceeds, alerting on anomalies instantly.
From my vantage as a compliance attorney, I’ve seen firms blindsided by unvisualized risks. Proactive graph interrogation prevents that; it quantifies exposure via metrics like risk propagation scores. Qulix’s design patterns for real-time sanctions screening integrate API feeds with graph databases, ensuring sub-second queries even on petabyte-scale ledgers. This isn’t optional; it’s the economic bulwark against fines that dwarf crypto gains.
Key Graph Analytics Benefits
-
Reduced False Positives: Analyzes transaction patterns to distinguish legitimate activity, cutting false positives by up to 90% (H3M Analytics).
-
Cross-Chain Tracing: Visualizes fund flows across blockchains for comprehensive illicit activity detection (Elliptic Navigator, Chainalysis).
-
Intuitive Visualizations: Interactive graphs reveal complex wallet relationships and networks at a glance.
-
Real-Time Alerts: Instant risk scoring and notifications for high-risk wallets and transactions (Global Ledger KYT).
-
Illicit Scheme Detection: Maps hidden connections to uncover money laundering and sanctions evasion (Crystal Blockchain).
Core Features Driving Effective Sanctions Screening Wallets
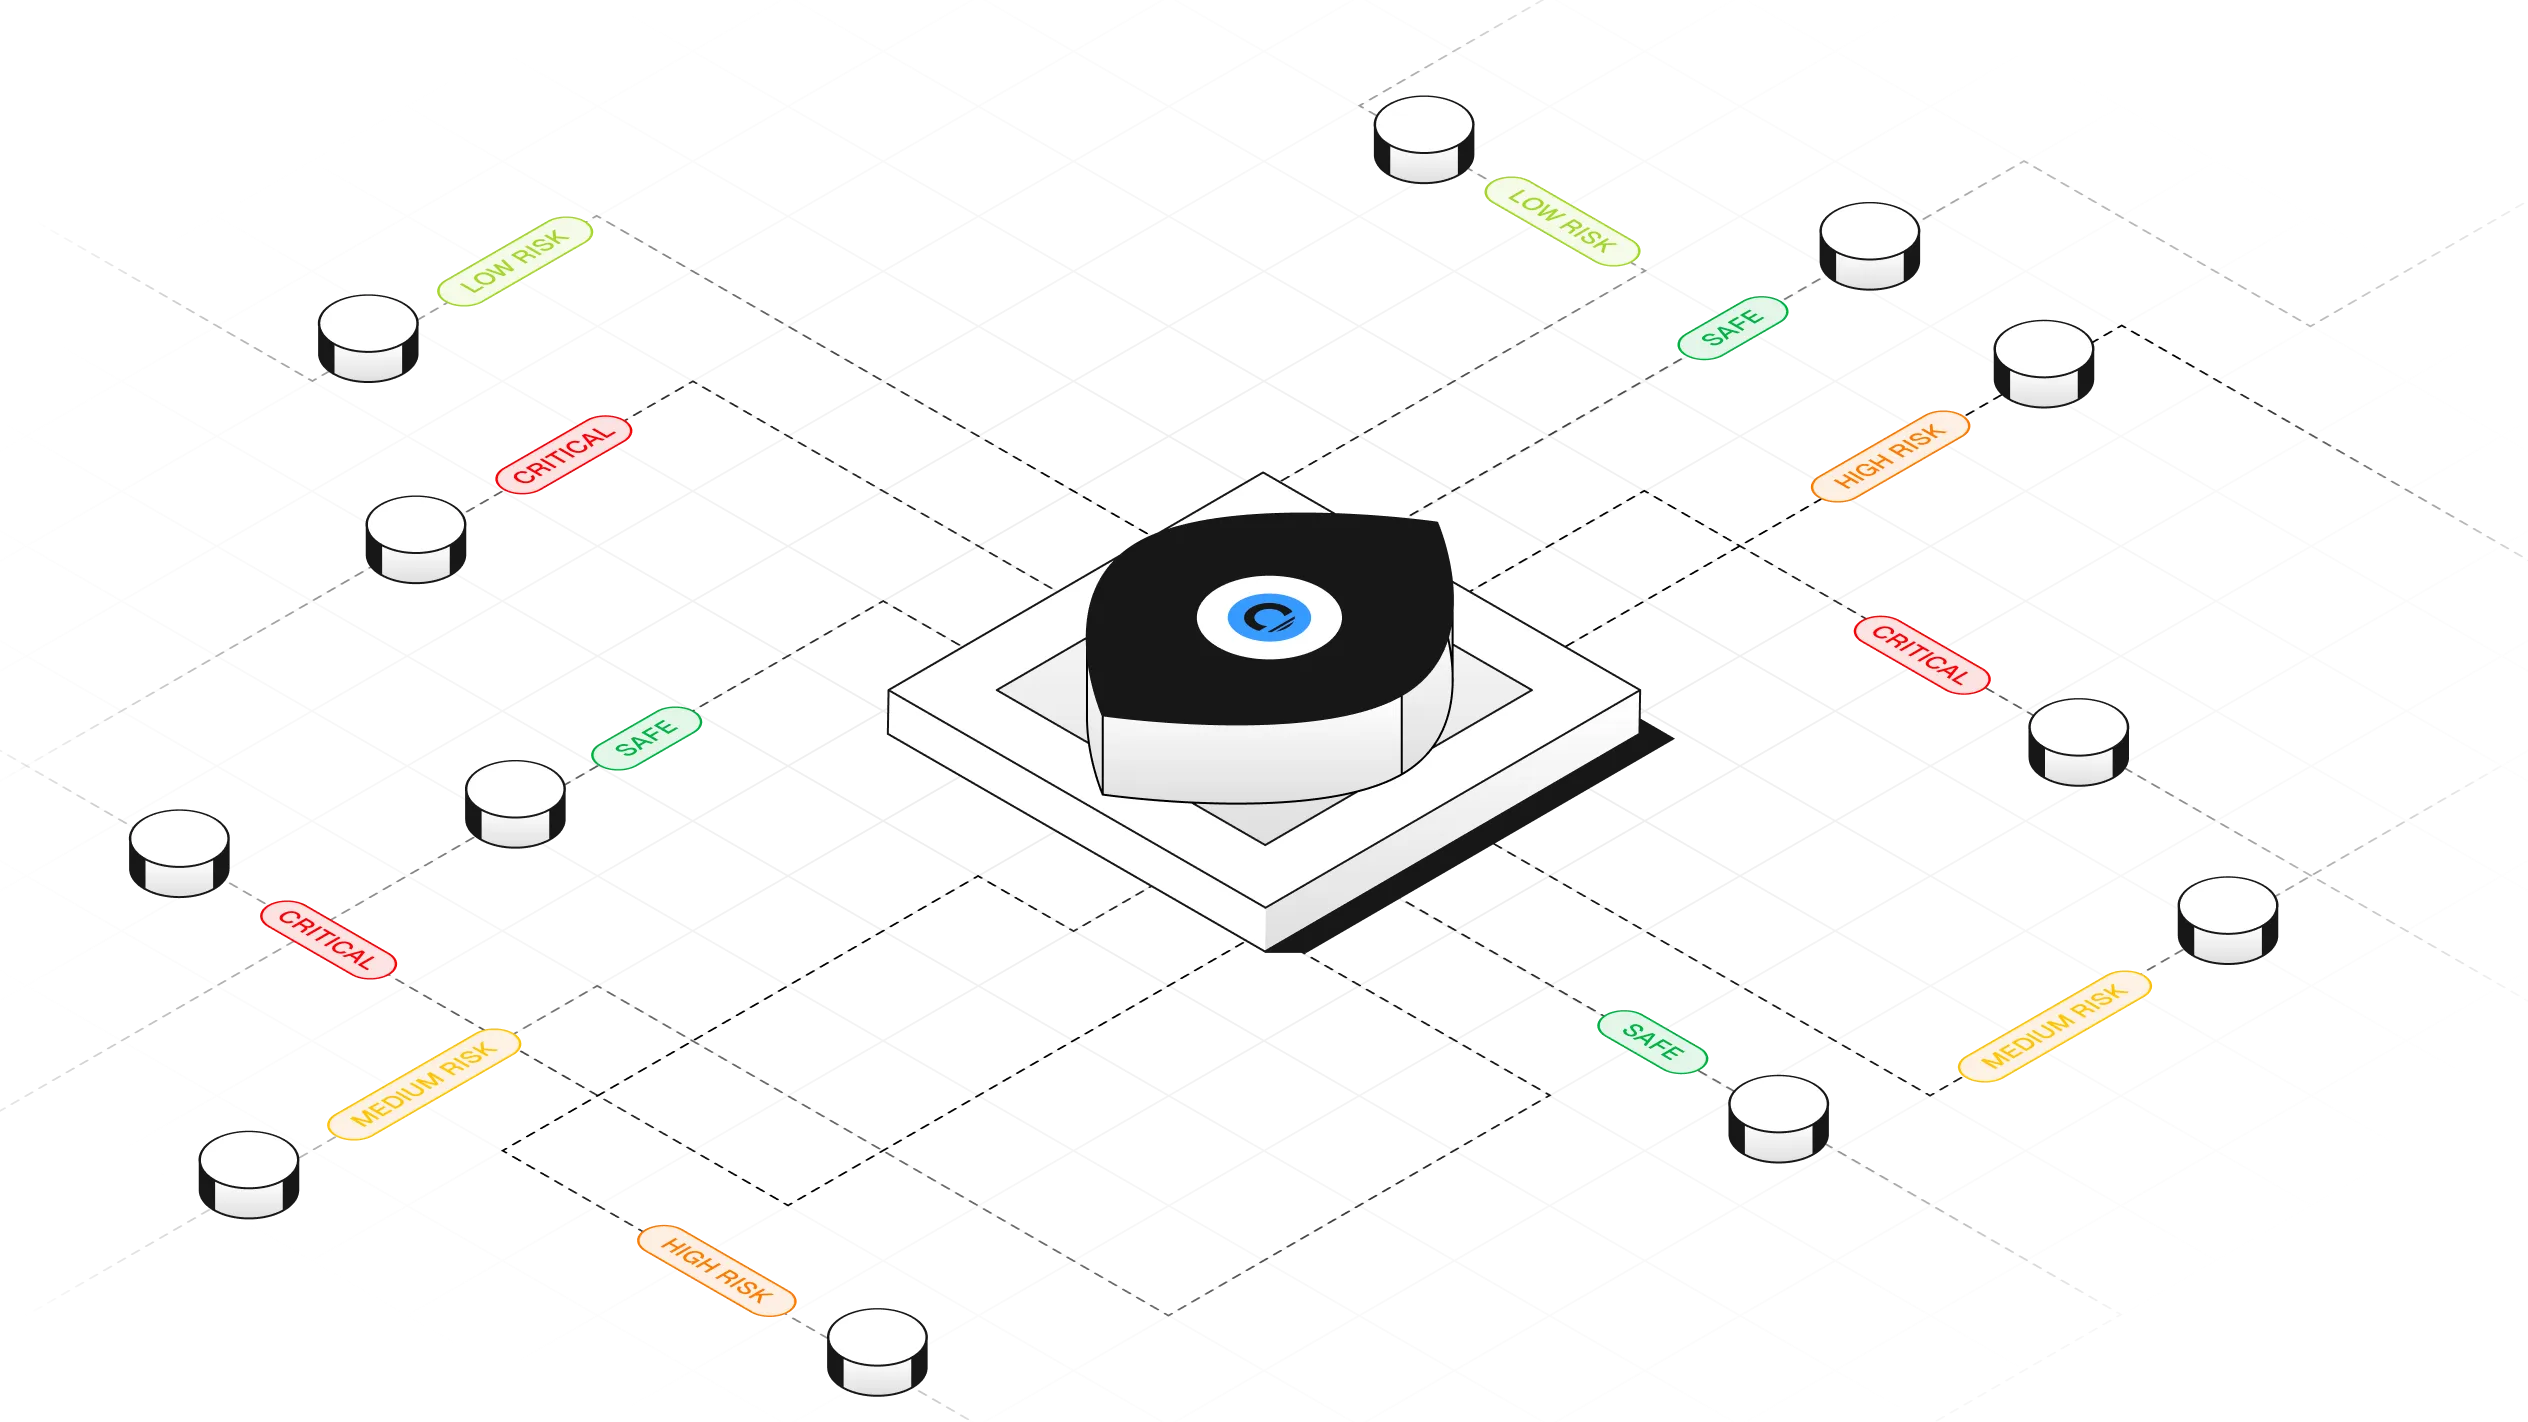
Leading graph analytics dashboards crypto platforms prioritize intuitive interfaces paired with computational muscle. Real-time ingestion from chains like Bitcoin and Ethereum feeds Neo4j or similar engines, where queries traverse billions of edges. Visualizations render force-directed layouts, zooming into suspect subgraphs; color-code by risk tier, from green-lit to red-flagged OFAC matches.
Elliptic Navigator and Crystal Blockchain exemplify this, monitoring cross-chain crime with verifiable evidence trails. Yet, the edge lies in heuristics: self-learning AI from H3M Analytics slashes false positives by 90 percent via link analysis. Kytgraph. com embodies this ethos, our graph tools clustering high-risk wallets with legal-grade precision. Users drill into source-of-funds narratives, export defensible reports, all while workflows automate blocks on tainted inflows.
Integrating AI and Heuristics for Precision KYT Transaction Monitoring
Static lists won’t suffice against mixers and privacy coins; dynamic heuristics adapt, scoring wallets on behavioral fingerprints. Global Ledger’s instant risk scores fuse on-chain with off-chain data, much like NOMINIS. io’s multi-chain alerts. Graph dashboards elevate this by propagating scores across clusters; if a hub wallet spikes, satellites inherit elevated scrutiny.
Elementus frames KYT as the paradigm shift from KYC, analyzing flows in real-time for illicit signals. In dashboards, timeline views overlay sanctions events with transaction spikes, correlating OFAC designations to wallet migrations. ChainUp’s compliance platforms underscore sanctions obligations met through such analytics. At Kytgraph, we stress customizable rulesets, letting firms tune for jurisdiction-specific nuances, from EU AMLD5 to FATF travel rule mandates.
Custom rulesets prove indispensable when jurisdictions diverge; a U. S. fintech might prioritize OFAC while a European exchange layers MiCA requirements. Graph analytics dashboards crypto tools like those from Kytgraph accommodate this, layering multi-jurisdictional screens atop behavioral graphs for holistic risk views.
Real-World Applications: Tools Shaping Sanctions Screening Wallets
Market leaders demonstrate graph analytics’ potency. Baltex Crypto AML Tool automates checks for sanctions, stolen funds, and darknet ties, approving clean flows instantly. AML Watcher’s real-time wallet screening flags persistent high-risk actors. Scorechain’s API scans against OFAC and FATF lists, embedding graph traversal for cluster detection. Crystal Blockchain traces cross-chain paths with courtroom-ready proofs, while Chainalysis offers free oracles for sanctions adherence. These align with Elliptic Navigator’s cross-chain crime detection, proving graph-powered KYT transaction monitoring scales from startups to banks.
Comparison of Key Graph Analytics Tools for Crypto Sanctions Screening
| Tool | Key Features | Strengths |
|---|---|---|
| Chainalysis | Sanctions screening API, on-chain oracle, KYT transaction monitoring at scale | Real-time alerts ✅, cross-chain support ✅, scalable compliance tools |
| Crystal Blockchain | Real-time wallet activity monitoring, cross-chain fund tracing, verifiable blockchain reports | Cross-chain tracing ✅, defensible evidence, clear visualizations |
| Elliptic Navigator | Real-time crypto transaction monitoring at scale, complex cross-chain crime detection | Real-time monitoring ✅, cross-chain support ✅, detects sophisticated schemes |
| Baltex Crypto AML Tool | Automated wallet checks for sanctions/stolen funds/darknet/fraud, non-custodial AML | Instant approve/block risky txns ✅, real-time intelligence, false positive reduction |
| AML Watcher | Real-time screening vs. global sanction lists, continuous high-risk wallet monitoring | Ongoing monitoring ✅, quick risk flagging, simple integration |
| Scorechain Sanctions Screening API | Automated address screening vs. OFAC/FATF/global watchlists | Regulatory compliance automation ✅, fast screening, broad list coverage |
I’ve advised firms integrating such dashboards; one exchange thwarted a $50 million mixer incursion by visualizing propagation from a sanctioned seed wallet. False positives plummeted, workflows streamlined, compliance officers regained bandwidth for strategy over firefighting. Proactive compliance prevents punitive realities, as these cases affirm.
Best Practices for Deploying Graph Analytics Dashboards Crypto
Implementation demands rigor. Start with data ingestion: pipe blockchain nodes into graph stores, normalizing addresses across chains. Calibrate heuristics against historical breaches; backtest against known Tornado Cash clusters or Ronin hacks. Train teams on query languages like Cypher, empowering ad-hoc investigations. Integrate with existing stacks via APIs, triggering holds on inbound risks exceeding thresholds. Regular audits validate visualizations against ground truth, ensuring dashboards reflect ledger realities without hallucination.
Crypto compliance visualizations shine in boardrooms, where executives grasp cluster exposures sans spreadsheets. Pair with alerting cascades: SMS for critical OFAC hits, Slack for medium risks. Kytgraph. com excels here, our dashboards fusing intuitive drags with enterprise-grade queries, reducing screening times by orders of magnitude.
Bitcoin Technical Analysis Chart
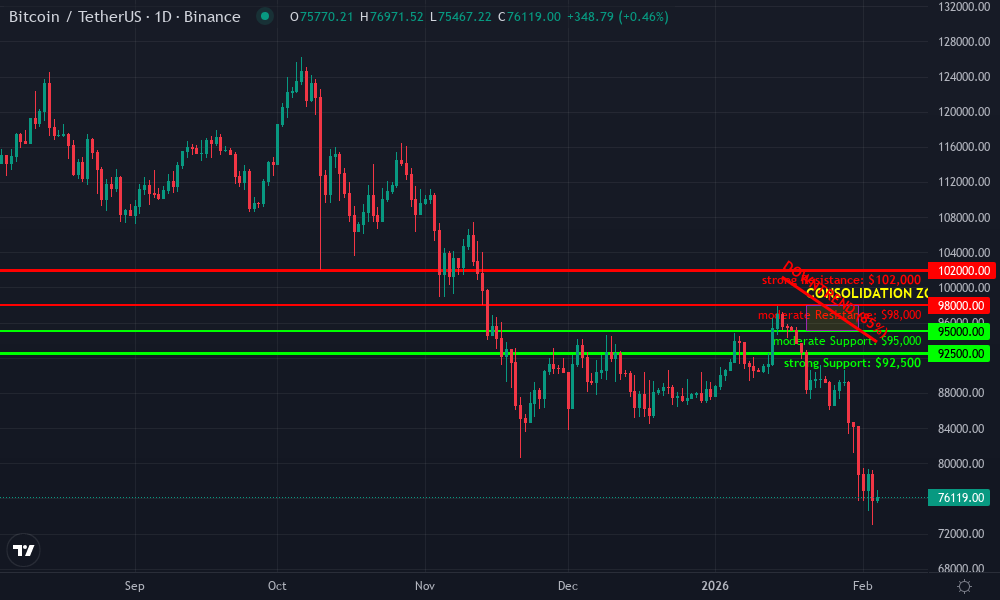
Analysis by Market Analyst | Symbol: BINANCE:BTCUSDT | Interval: 1D | Drawings: 6
Technical Analysis Summary
As a balanced technical analyst with 5 years experience, start by drawing a prominent downtrend line connecting the swing high on 2026-01-15 at approximately 101,200 to the recent swing high on 2026-02-01 at 94,800, extending it forward to project potential continuation. Add horizontal support lines at 92,500 (strong recent lows) and 95,000 (prior consolidation base). Mark resistance horizontals at 98,000 (recent breakdown level) and 102,000 (January high). Use rectangles to highlight the late January consolidation range between 95,000-98,000 from 2026-01-20 to 2026-01-31. Place a long_position order line near 92,500 support with stop below 91,500 and profit target at 98,000. Add callouts for volume spike on the February breakdown and MACD bearish crossover in late January. Include arrow_mark_down at the breakdown point around 2026-02-01. Use text notes for key insights like ‘Oversold bounce potential at support’. This setup captures the dominant downtrend while highlighting reversal opportunities aligned with medium risk tolerance.
Risk Assessment: medium
Analysis: Established downtrend increases short-term risk, but oversold signals and support confluence offer balanced long setup with defined risk
Market Analyst’s Recommendation: Enter longs at 92,500 support with tight stops; scale out at resistance. Avoid if breaks 91,500.
Key Support & Resistance Levels
📈 Support Levels:
-
$92,500 – Strong recent lows with volume spike, potential bounce zone
strong -
$95,000 – January consolidation low, prior test
moderate
📉 Resistance Levels:
-
$98,000 – Recent breakdown level, first hurdle on bounce
moderate -
$102,000 – January monthly high, key resistance
strong
Trading Zones (medium risk tolerance)
🎯 Entry Zones:
-
$92,500 – Confluence of trendline projection, volume exhaustion, and strong support
medium risk
🚪 Exit Zones:
-
$98,000 – Initial resistance test for partial profits
💰 profit target -
$91,500 – Below recent lows to protect against further downside
🛡️ stop loss
Technical Indicators Analysis
📊 Volume Analysis:
Pattern: climactic on downside, low on pullback
High volume on Feb 1-2 drop suggests selling exhaustion, watch for pickup on upside
📈 MACD Analysis:
Signal: bearish but flattening
MACD line below signal and zero, histogram contracting – potential divergence if price holds support
Applied TradingView Drawing Utilities
This chart analysis utilizes the following professional drawing tools:
Disclaimer: This technical analysis by Market Analyst is for educational purposes only and should not be considered as financial advice.
Trading involves risk, and you should always do your own research before making investment decisions.
Past performance does not guarantee future results. The analysis reflects the author’s personal methodology and risk tolerance (medium).
Challenges persist: privacy coins obscure edges, but heuristics infer via timing attacks or change address patterns. Multi-chain sprawl tests scalability, yet federated graphs bridge silos. Forward-thinking platforms evolve, incorporating zero-knowledge proofs for compliant visualizations.
Regulatory horizons sharpen focus. FATF’s 2026 travel rule expansions demand originator-beneficiary graphing, while EU’s MiCA enforces wallet risk disclosures. Graph analytics dashboards position firms ahead, turning compliance from cost center to competitive edge. KYT transaction monitoring isn’t mere checkbox; it’s the forensic lens demystifying decentralized opacity.
Firms wielding these tools navigate crypto’s wilds with precision, clustering threats before they metastasize. Sanctions screening wallets via graphs isn’t futuristic; it’s table stakes for survival in a scrutinized ecosystem. At Kytgraph. com, we equip compliance warriors with unmatched graph intelligence, ensuring your operations thrive amid volatility.