
Picture this: Bitcoin cruising at $66,787, shrugging off a 0.84% dip, while shadowy Russian wallets weave through blockchains like ghosts in the machine. Sanctions evasion isn't just a headline grabber; it's a trillion-dollar threat testing the limits of crypto compliance. As a swing trader who's navigated seven years of market swings with KYT graph analytics, I've watched these networks evolve. But here's the good news: graph analytics from platforms like Kytgraph. com are flipping the script, spotting sanctions evasion crypto wallets before they slip away. Let's dive into how this tech is empowering you to trade smart and stay compliant.
Unmasking Russia's Crypto Evasion Tactics in 2025
Russia-linked flows dominated sanctions activity last year, per Chainalysis and TRM Labs reports. The A7 wallet cluster alone tied to $39 billion in dodgy transactions. Why? Stablecoins like USDT on TRON became lifelines for sanctioned banks, swapping ruble-pegged assets via high-risk VASPs. Legacy tools screening single assets? They're toast. Enter KYT graph analytics Russia-style: mapping wallet clusters, peeling back mixers, and flagging proximity to OFAC SDN lists.
Think about Iurii Gugnin's $500 million USDT scheme. He funneled funds through U. S. VASPs for Russian clients, evading traditional checks. Graph analytics lit up those connections, proving why Russian crypto sanctions screening demands network views, not isolated addresses. Elliptic's typologies report nails it: quality over quantity in 2026 screening, slashing false positives and speeding probes.
Graph Analytics: The Game-Changer for Wallet Transaction Monitoring
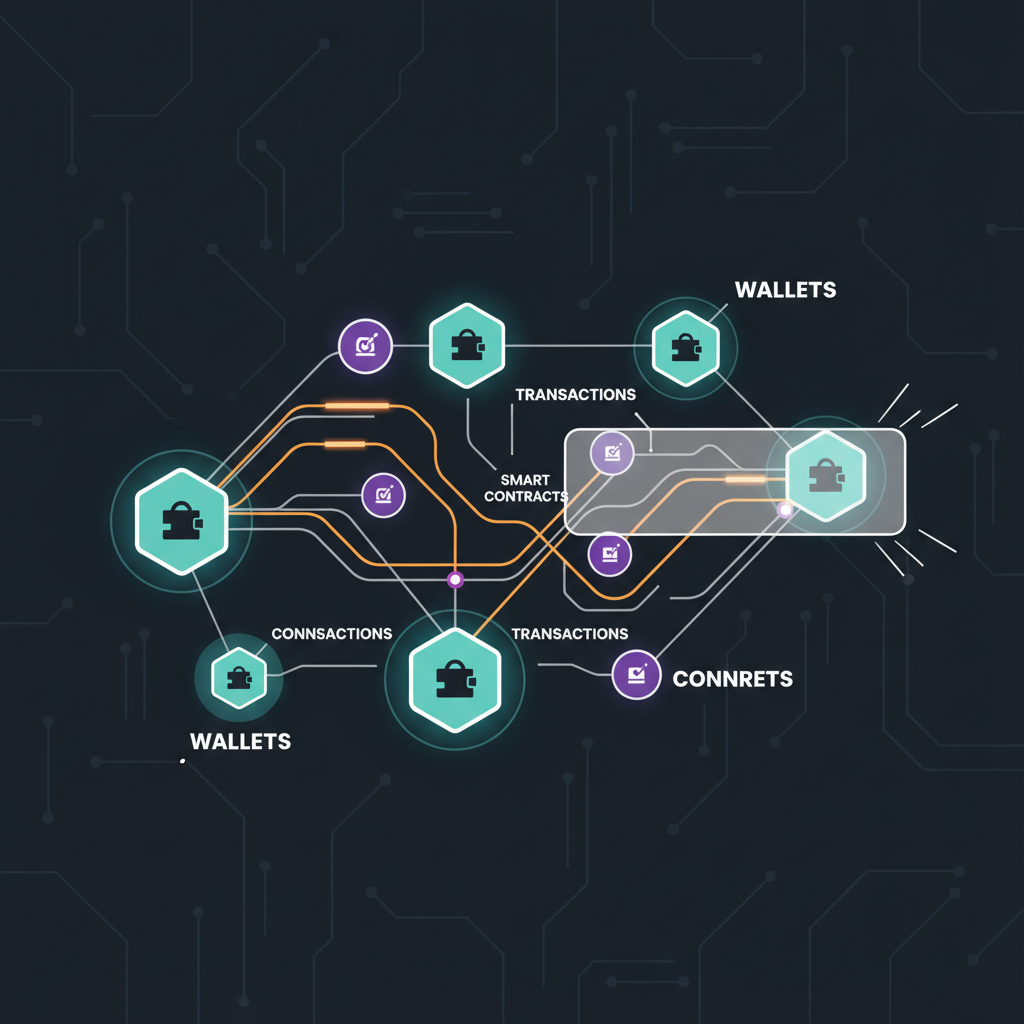
Graphs aren't just pretty charts; they're your motivational edge in compliance. At Kytgraph. com, we leverage transaction proximity metrics, like those from recent arXiv research, to gauge wallet distances from exchanges. Close ties to Garantex-style hubs? Red flag city. This isn't passive screening; it's proactive hunting, clustering high-risk wallets with heuristics that evolve faster than evasion tactics.
Moody's 2026 sanctions outlook warns of sophisticated laundering rings, from Operation Destabilise to A7A5 tokens popping up post-Garantex takedown. A7A5, ruble-backed on Ethereum and TRON, swapped billions into USDT via DEXs. Graph tools trace these flows, revealing obfuscated addresses and VASP bridges. I've swung trades dodging these risks, turning transparency into profit shields. You can too provides wallet transaction monitoring sanctions via graphs cuts investigation time, letting you focus on momentum plays.
Case Study: Disrupting Garantex and the A7 Shadow Network
Garantex wasn't just an exchange; it was a sanctions superhighway, processing over $60 billion in USDT despite 2022 OFAC hits. U. S. authorities seized $26 million in 2025, thanks to blockchain sleuthing that graph analytics supercharged. Visualize the web: wallets clustering around Garantex inputs, fanning out to mixers, then U. S. VASPs. Kytgraph. com's real-time visuals make this digestible, highlighting OFAC SDN list graph analysis for instant risk scores.
Post-bust, A7 emerged, linking to $39 billion per TRM. TRON dominance? No problem, our graphs hop chains, scoring multi-asset risks. Elliptic's five steps for 2026 compliance start with holistic screening, exactly what graph tech delivers. Data quality barriers? Crushed by our heuristics. As compliance pros ramp up, these tools aren't optional; they're your swing trading secret weapon, ensuring every entry point is clean.
Imagine entering a swing trade on Bitcoin at $66,787, confident that your funding wallet isn't tangled in A7's web. That's the power shift graph analytics brings to sanctions evasion crypto wallets. Legacy systems choke on false positives; our network views deliver precision, turning compliance into a competitive edge. Traders like me thrive by layering KYT insights over technicals, catching momentum in clean flows while regulators applaud.
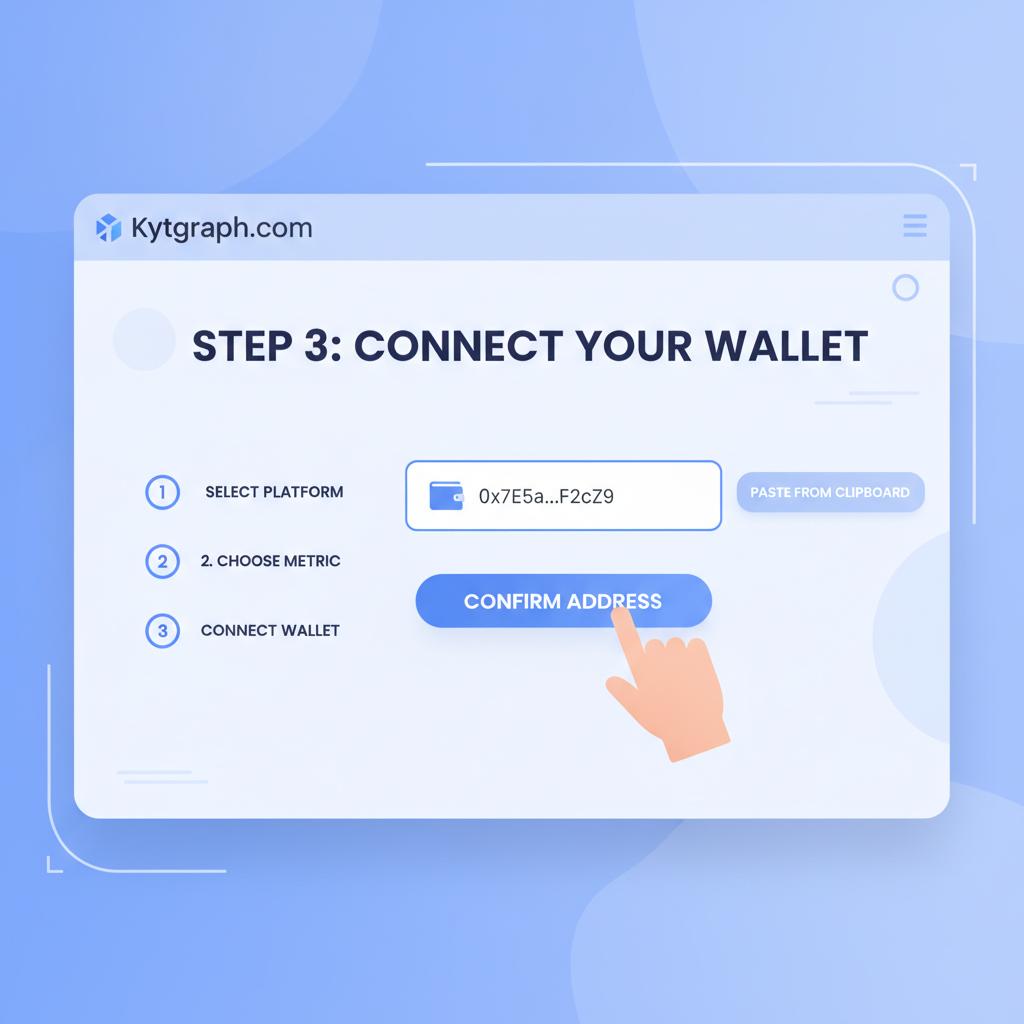
Hands-On: Integrate Graph Analytics into Your Workflow
KYT isn't theoretical; it's your daily toolkit. Platforms like Kytgraph. com pull real-time blockchain data, building dynamic graphs that score wallets on sanctions proximity, mixer exposure, and VASP ties. Russian flows favor TRON and Ethereum? No sweat; cross-chain heuristics flag ruble-pegged swaps instantly. Per Elliptic's 2026 compliance steps, start with quality data ingestion, then layer behavioral clustering. This slashes investigation times, freeing you for trades that stick.
Shield Your Trades: 5 Steps to Screen Wallets for Russian Sanctions Evasion with Kytgraph
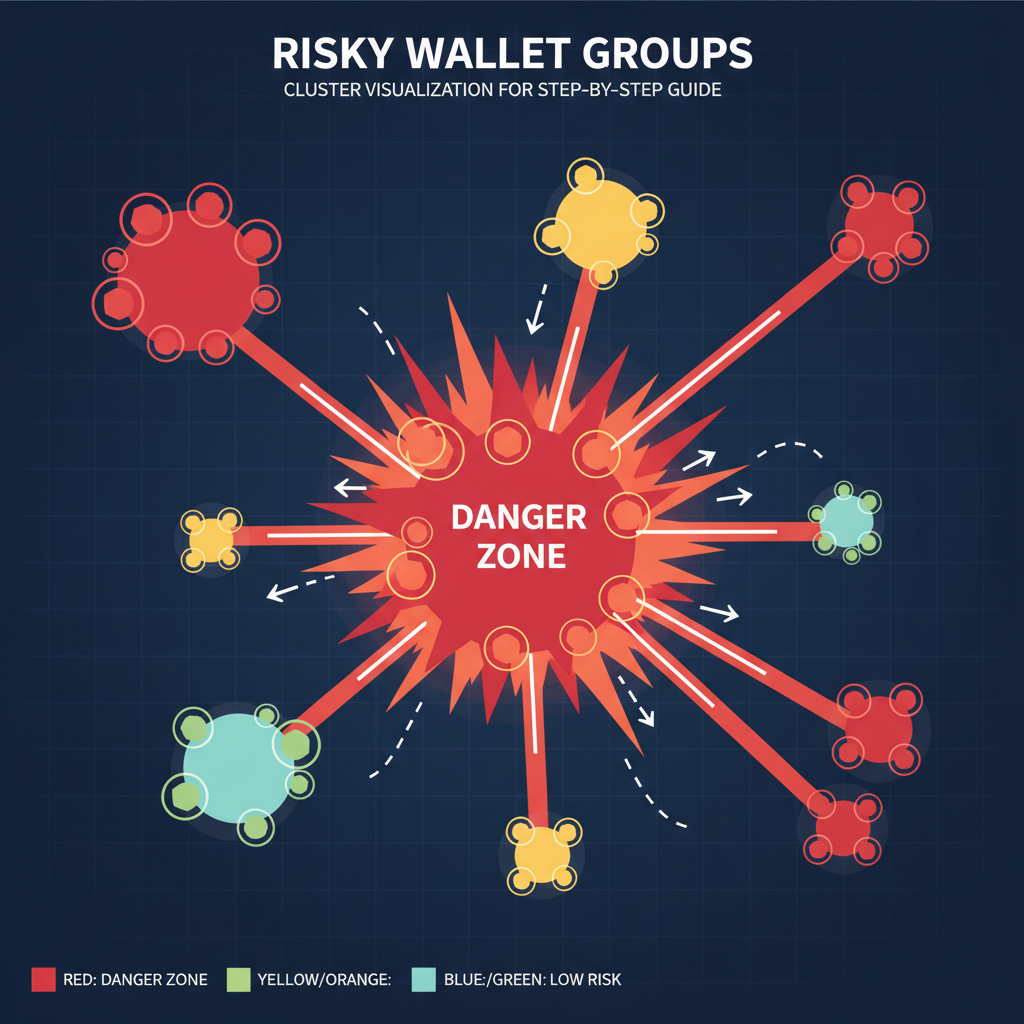
Once scanned, visuals pop: nodes for wallets, edges for flows, colors coding risk from green (safe) to red (evade). I've dodged dips by exiting positions linked to high-proximity clusters, preserving capital amid volatility. ChainUp's crypto tracing echoes this: RegTech turns pseudonymous addresses into profiled risks, flipping blockchain transparency into your ally.
Why 2026 Demands Graph-Powered KYT Over Legacy Screening
RegTech Analyst nails it: accuracy trumps volume now. Sanctions lists balloon, corporate veils thicken, crypto exposure hits 7.38% per Alessa's insights. Single-asset checks miss A7A5's multi-chain dance; graph analytics don't. KYC Chain's KYT pitch resonates: map real-world risks to addresses, monitor transactions proactively. For Russian crypto, this means clustering OFAC-proximal wallets, predicting evasion pivots like Garantex to A7.
TRM Labs pegs A7 at $39 billion; Moody's flags enforcement ramps. Graph tools evolve with them, incorporating transaction proximity from arXiv innovations. Measure hops from known bad actors; under three? Probe deeper. This medium-risk approach suits swing traders: enter on bullish candlesticks, exit on red flags, all compliant. Bitcoin's steady at $66,787 proves resilient markets reward the vigilant.
Legacy vs Graph Analytics for Sanctions Screening
| Feature | Legacy Tools | Graph Analytics |
|---|---|---|
| Asset Coverage | Single | Multi-chain |
| False Positives | High | Low |
| Investigation Time | Days | Minutes |
| Russian Evasion Detection | Basic | Advanced Clustering |
Operation Destabilise exposed espionage ties; graph sleuthing unraveled them. Forward-looking, 2026's game is predictive scoring. Kytgraph. com heuristics forecast risks from flow patterns, alerting before indictments like Gugnin’s drop. Compliance pros streamline workflows; traders unlock compliant alpha.
Swing smart amid sanctions storms. With graph analytics, you're not reacting; you're ahead, turning evasion cracks into your gains. Platforms empowering this shift make every wallet check a step toward unshakeable portfolios. Spot the compliant momentum, flag the shadows, and trade with the confidence that compliance fuels profits.


No comments yet. Be the first to share your thoughts!