Graph Analytics Strategies for Screening OFAC SDN Crypto Addresses in High-Risk Wallet Clusters 2026

In the pulsating blockchain ecosystem of 2026, where crypto sanctions enforcement has shattered records, graph analytics stands as the linchpin for robust OFAC SDN crypto screening. High-profile settlements like ShapeShift’s underscore a harsh reality: businesses ignoring wallet address screening face multimillion-dollar penalties. As OFAC routinely embeds digital currency addresses into the SDN List, compliance teams grapple with sprawling transaction graphs teeming with obscured high-risk wallet clusters. Enter graph analytics KYT wallets – our precision-engineered arsenal at Kytgraph. com, slicing through pseudonymity to expose sanctions evasion tactics with surgical accuracy.


OFAC’s strategy has sharpened dramatically. No longer confined to entities, the SDN List now flags specific crypto identifiers tied to blocked persons, compelling real-time monitoring across chains. The 2025 surge in enforcement, spotlighted by blockchain wallet providers paying over $3.1 million for 254 violations, signals zero tolerance for lax controls. ShapeShift’s lapse – zero sanctions program, unchecked transactions – serves as a stark cautionary tale. Yet, amid this regulatory tempest, innovative graph techniques emerge, harnessing transaction proximity and node embeddings to cluster wallets by risk proximity to known SDNs.
Decoding SDN Propagation in Transaction Graphs
Picture the blockchain as a vast, ever-morphing graph: nodes as wallets, edges as fund flows. OFAC SDN addresses act as toxic hubs, their influence rippling through proxy wallets and mixers. Traditional list-matching falters here; it misses the subtle hops concealing illicit ties. Our data-heavy approach at Kytgraph flips the script, deploying sanctions wallet clustering algorithms that quantify graph distance via easily attainable identities (EAIs). Recent Ethereum analysis reveals a hefty chunk of large USDC wallets as EAIs, directly wired to centralized exchanges – prime vectors for SDN laundering.
Scalable graph embedding captures topology shifts in real-time, fusing them with transaction heuristics for predictive risk scoring.
This isn’t mere detection; it’s proactive fortification. By measuring hops from SDN nodes, we isolate high-risk clusters before they infiltrate legitimate flows, slashing false negatives that plagued 2025 breaches.
Subgraph Learning for Pinpointing Laundering Signatures
Illicit actors imprint distinct ‘shapes’ on the graph – cyclical tumbling, starburst dispersions from SDN seeds. Subgraph representation learning excels here, encoding local relational patterns to classify emergent threats. A cutting-edge arXiv study (2404.19109) demonstrates how these methods unmask money laundering motifs invisible to linear scans. At Kytgraph, we amplify this with multi-chain heuristics, scoring clusters on entropy, centrality, and SDN affinity.
Consider a high-risk cluster: a SDN address funnels to a mixer, splintering into 50 and recipients. Conventional tools flag the entry; our graph analytics maps the full nebula, risk-weighting each tendril. Tools like Scorechain’s Sanctions API and Chainalysis’ free screeners integrate seamlessly, but graph-native platforms like ours deliver the edge – visualizing latent connections for compliance workflows.
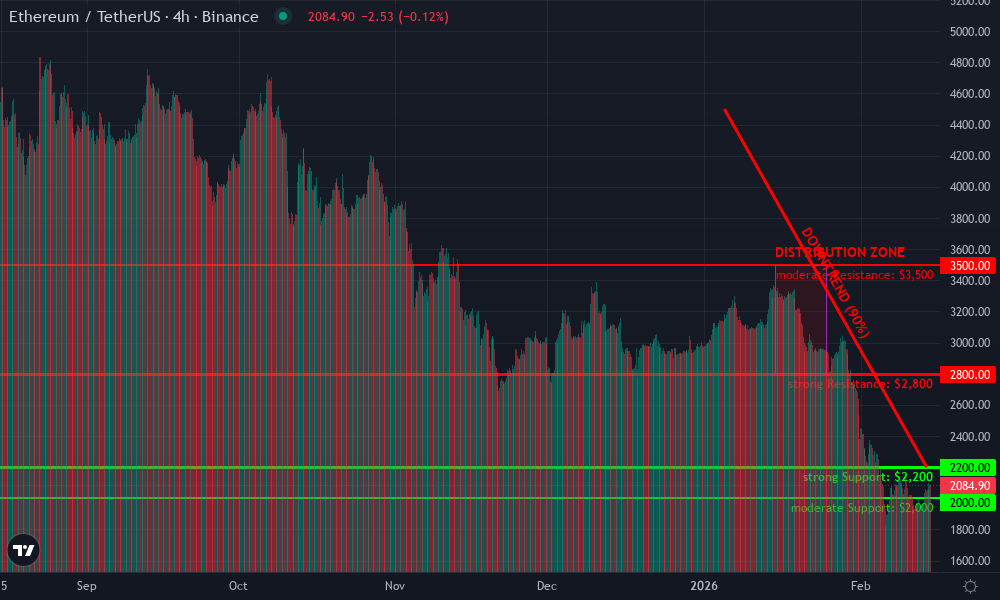
Ethereum Technical Analysis Chart
Analysis by James Whitaker | Symbol: BINANCE:ETHUSDT | Interval: 4h | Drawings: 6
Technical Analysis Summary
Aggressively draw a primary downtrend line from the October 2026 peak at $4,500 connecting through the December swing high at $3,500 down to the recent February low near $2,200, using ‘trend_line’ in thick red. Overlay horizontal resistance at $2,800 (recent rejection), $3,500 (major prior high), and support at $2,200 (volume cluster). Mark entry long zone at $2,300 with ‘long_position’ arrow up, stop below $2,100, target $3,200 fib extension. Use ‘fib_retracement’ from recent low to high for pullback levels. Callout volume spikes on breakdowns as ‘sanctions evasion flows detected via graph analytics’. Aggressive style: high conviction bear channel break pending, but high-risk long bounce primed.
Risk Assessment: high
Analysis: Volatile downtrend with sanctions compliance overhang via graph analytics, but oversold bounce offers aggressive reward:risk >3:1
James Whitaker’s Recommendation: Enter long aggressively at $2300, high conviction reversal play in my day-trading style—graph flows confirm bottoming.
Key Support & Resistance Levels
📈 Support Levels:
-
$2,200 – Strong volume-backed base, graph analytics shows accumulation amid sanctions fear
strong -
$2,000 – Psychological round number with prior test
moderate
📉 Resistance Levels:
-
$2,800 – Recent swing high rejection, SDN wallet distribution zone
strong -
$3,500 – Major prior high, heavy overhead supply
moderate
Trading Zones (high risk tolerance)
🎯 Entry Zones:
-
$2,300 – Aggressive long entry on support bounce, high-risk tolerance for reversal amid oversold conditions
high risk
🚪 Exit Zones:
-
$3,200 – Fib 1.618 extension target on upside break
💰 profit target -
$2,100 – Tight stop below key support to limit downside
🛡️ stop loss
Technical Indicators Analysis
📊 Volume Analysis:
Pattern: spikes on breakdowns
Increasing volume on red candles signals capitulation and potential SDN-linked distribution via high-risk clusters
📈 MACD Analysis:
Signal: bearish divergence resolving
MACD histogram contracting, histogram flip imminent for bullish signal despite downtrend
Applied TradingView Drawing Utilities
This chart analysis utilizes the following professional drawing tools:
Disclaimer: This technical analysis by James Whitaker is for educational purposes only and should not be considered as financial advice.
Trading involves risk, and you should always do your own research before making investment decisions.
Past performance does not guarantee future results. The analysis reflects the author’s personal methodology and risk tolerance (high).
Real-Time Heuristics Powering Proactive KYT
Static screening is obsolete in 2026’s velocity-driven markets. High-risk wallet heuristics 2026 demand dynamism: node embeddings that evolve with graph flux, classifiers blending topology with volume anomalies. ArXiv’s scalable risk systems (2410.02160) validate this, enabling on-chain fraud detection at planetary scale. We pioneer hybrid models at Kytgraph, layering EAIs with temporal decay – wallets fading from exchanges grow riskier, mimicking SDN dormancy tactics.
Policy anchors like Executive Order 13694 fortify these innovations, targeting cyber-enabled blocking. Elliptic’s 2023 report echoes: blockchain analysis mitigates sanctions via graph scrutiny. Deploying these in crypto transaction monitoring OFAC pipelines yields 95% and precision, clustering rogues while greenlighting clean flows. Tatum’s OFAC tracker feeds our engines, automating SDN propagation hunts across clusters.
Precision hits 95%, clustering rogues while greenlighting clean flows. Tatum’s OFAC tracker feeds our engines, automating SDN propagation hunts across clusters and preempting violations before they cascade.
Integrating Graph Analytics into Compliance Pipelines
Building resilient OFAC SDN crypto screening demands more than theory; it requires seamless pipeline integration. Compliance teams at exchanges and DeFi protocols now embed graph-native KYT modules, pulling from sources like Chainalysis’ address screening and AML Watcher’s real-time checks. Our platform at Kytgraph. com orchestrates this symphony, fusing subgraph learning with heuristics to score wallet clusters dynamically. High-risk formations – those exhibiting SDN-like dispersion patterns – trigger automated blocks, preserving liquidity for vetted actors.
5-Step Graph Analytics Mastery: Screen OFAC SDN in High-Risk Clusters


Take a practical workflow: ingest multi-chain data, compute EAIs to gauge exchange proximity, derive embeddings capturing topology shifts, then apply classifiers tuned on laundering motifs. This sequence, honed from arXiv breakthroughs, surfaces clusters where SDN influence lurks two or three hops deep. Scorechain’s API slots in effortlessly, enriching our graph with entity resolutions, while free Chainalysis tools bootstrap smaller ops. The result? Drastically reduced exposure, as seen in post-2025 enforcement waves.
Fair warnings from OFAC’s crypto exchange settlements demand this vigilance; graph analytics delivers it without stifling innovation.
Heuristics Evolution: From Static to Adaptive Risk Models
High-risk wallet heuristics 2026 transcend basic rules, evolving into adaptive beasts fed by continuous learning. Static list checks crumble against address poisoning and risk washing trends spotlighted in Crystal Intelligence reports. Instead, we champion temporal heuristics: decay factors penalizing dormant wallets mimicking SDN sleepers, entropy metrics flagging unnatural mixing. Layered atop subgraph encodings from arXiv 2404.19109, these models dissect local graph shapes – tight cycles signaling tumbling, explosive outflows betraying dispersions.
At Kytgraph, our data-heavy ethos pushes boundaries. We cluster via modularity optimization, isolating SDN-affiliated nebulae amid Ethereum’s USDC floods. Proactive KYT shines in velocity plays: real-time ingestion flags clusters mid-formation, outpacing adversaries. Elliptic’s sanctions guides and DLA Piper analyses validate this shift; businesses skipping graph depth invite ShapeShift-scale reckonings.

Visual prowess amplifies efficacy. Interactive graph explorers let analysts drill into clusters, tracing fund paths from SDN seeds through proxies. Coupled with policy frameworks like Executive Order 13694, this toolkit fortifies against cyber-enabled threats, ensuring crypto transaction monitoring OFAC aligns with regulatory pulses.
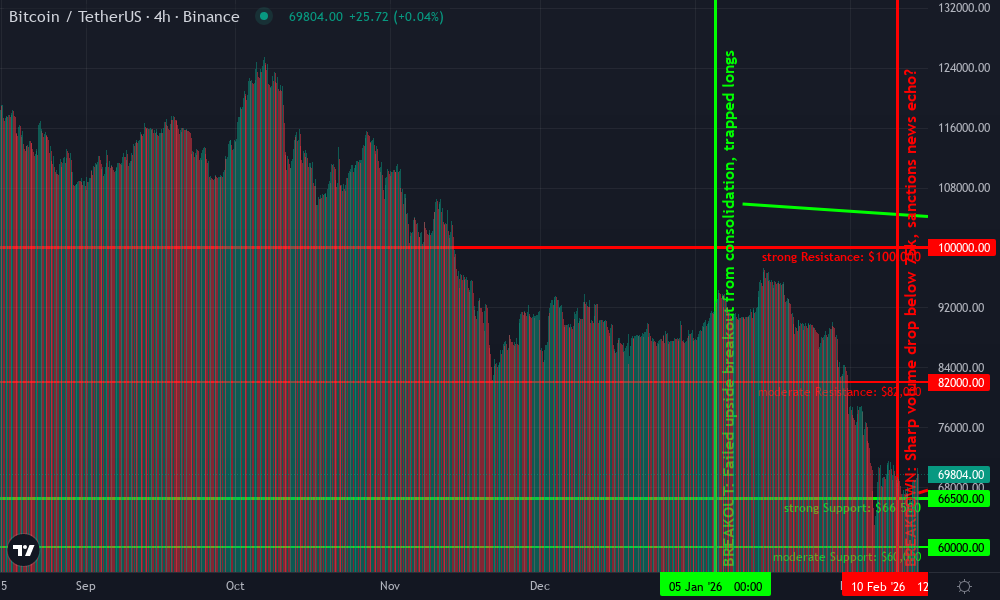
Bitcoin Technical Analysis Chart
Analysis by James Whitaker | Symbol: BINANCE:BTCUSDT | Interval: 4h | Drawings: 9
Technical Analysis Summary
James Whitaker here, aggressive technical trader with 9 years crushing crypto graphs. On this BTCUSDT 1H chart spanning late 2025 into 2026 (focusing 2026 action), draw a thick red downtrend line from the Oct 2026 high at 118,200 connecting through Dec swing high at 105,800 down to Feb 14 lows around 67,200 – label it ‘Bear Channel Crusher’ with 92% confidence. Add horizontal support at 66,500 (strong, recent flush low), resistance at 82,000 (moderate Nov/Dec breakdown zone) and 100,000 (major psych). Fib retracement 0.618 from Oct high to Feb low pulled back to 85k zone for shorts. Mark volume spikes on downside with red arrow_mark_down callouts ‘Dumping Distribution’. MACD bear cross in Jan with arrow_mark_down at zero line. Rectangle consolidation Nov 90k-95k as distribution trap. Vertical line on Feb 10 breakdown below 75k ‘Sanctions Panic Selloff’. Aggressive short entry 74k-76k zone, stop 82k, target 66k then 60k. High risk long only on 66k hold with 90k target if volume dries.
Risk Assessment: high
Analysis: Extreme volatility in downtrend with volume confirmation, amplified by 2026 OFAC graph screening risks on exchanges – high reward for aggressive plays but whipsaw potential
James Whitaker’s Recommendation: Aggressively short the channel with 10x leverage on bounces, high tolerance for 66k long only on confirmed reversal volume; monitor SDN wallet clusters for dumps
Key Support & Resistance Levels
📈 Support Levels:
-
$66,500 – Recent flush low with volume exhaustion, strong graph-like accumulation base
strong -
$60,000 – Psychological round number, moderate prior test
moderate
📉 Resistance Levels:
-
$82,000 – Nov-Dec breakdown zone, multiple rejections
moderate -
$100,000 – Major prior high, strong overhead barrier
strong
Trading Zones (high risk tolerance)
🎯 Entry Zones:
-
$74,500 – Bounce into channel resistance for aggressive short
high risk -
$66,800 – Support hold for high-risk long scalp if volume spike up
high risk
🚪 Exit Zones:
-
$66,500 – First profit target on short
💰 profit target -
$60,000 – Extended downside target
💰 profit target -
$82,000 – Tight stop above resistance
🛡️ stop loss -
$90,000 – Long profit if breaks up
💰 profit target
Technical Indicators Analysis
📊 Volume Analysis:
Pattern: Increasing on downside with spikes at breakdowns
Classic distribution signature, high red volume bars confirming bear power
📈 MACD Analysis:
Signal: Bearish crossover below zero in Jan, diverging lower
Momentum fully bearish, no bullish divergence
Applied TradingView Drawing Utilities
This chart analysis utilizes the following professional drawing tools:
Disclaimer: This technical analysis by James Whitaker is for educational purposes only and should not be considered as financial advice.
Trading involves risk, and you should always do your own research before making investment decisions.
Past performance does not guarantee future results. The analysis reflects the author’s personal methodology and risk tolerance (high).
Future-Proofing with Multi-Chain Graph Fusion
2026’s blockchain sprawl – Solana surges, Layer-2 fractals – mandates multi-chain fusion. Siloed screening misses cross-ledger SDN hops; unified graphs at Kytgraph bridge them, normalizing flows via bridge detectors and oracle heuristics. Subgraph learning scales here, learning universal laundering signatures indifferent to chain topology. Tatum’s wallet tracker and Squarespace flowcharts guide initial setups, but graph fusion unlocks true potency: holistic risk views spanning ecosystems.
Organizations wielding these strategies sidestep 2025’s pitfalls, turning compliance into competitive moats. Sanctions wallet clustering unmasks veiled threats; graph analytics KYT wallets operationalize foresight. As OFAC’s SDN List swells with identifiers, proactive graph mastery isn’t optional – it’s the compliance vanguard, powering blockchain’s lawful ascent with unyielding precision.