As the European Union gears up for its 20th sanctions package against Russia, set for finalization within weeks from February 9,2026, compliance teams in the crypto space face heightened scrutiny. This package builds on the 19th round from October 2025, which banned transactions tied to the rouble-backed stablecoin A7A5 and severed links to Russia's Mir and SBP payment systems. Now, whispers from EU Commission President Ursula von der Leyen point to outright bans on the digital ruble and interactions with Russian crypto-asset service providers. For financial institutions and blockchain firms, EU Russia sanctions crypto wallets screening isn't optional; it's a regulatory imperative. Graph analytics emerges as the linchpin, revealing concealed connections that traditional checks miss.
Decoding the 20th Package: Crypto Transaction Bans and Digital Ruble Crackdown
The proposed measures signal a seismic shift. Earlier sanctions, like the 2022 cap of 10,000 euros on Russian holdings in EU wallets, were mere speed bumps. This 20th iteration eyes a total transaction ban, explicitly prohibiting EU firms from dealing with Russian crypto services and the digital ruble. Sources from ACAMS, MEXC, and Whale Alert confirm the scope: no maritime services for Russian crude, blacklisting of banks and crypto traders, and choking off digital payment lifelines. With 4,283 individuals and 1,487 entities already under 33 regimes per the EU sanctions tracker, the net widens.
Why does this matter for wallets? Sanctioned actors pivot to crypto for evasion, clustering funds across pseudonymous addresses. Without advanced tools, spotting these flows is like chasing shadows. 20th sanctions package wallet screening demands peering beyond surface-level addresses into relational webs. Proactive compliance prevents punitive realities, as I always emphasize.
From 19th Package Lessons: Stablecoins and Payment System Severance
The 19th package set the stage by sanctioning A7A5 developers and traders, recognizing how stablecoins mask fiat flows. Russia's SBP and Mir integrations with crypto were axed, forcing reliance on decentralized alternatives. Yet, graph analytics from platforms like Kytgraph. com already proved invaluable, clustering high-risk wallets and flagging illicit ties in real-time.
Consider the mechanics: traditional KYT scans addresses against lists, but graph tools map multi-hop connections. A wallet receiving from a sanctioned entity via mixers? Exposed. Heuristics detect behavioral anomalies, like sudden volume spikes post-sanctions. In my 16 years advising fintechs, I've seen firms evade millions in fines by integrating such tech early.
Russia's crypto pivot demands our sharpest tools; graph analytics delivers the edge.
KYT Graph Analytics: Unmasking Sanctions Evasion in Wallet Clusters
Enter KYT graph analytics sanctions solutions. These leverage network theory to construct wallet graphs, where nodes are addresses and edges are transactions. Algorithms like community detection cluster wallets by shared histories, isolating Russian-linked groups even if direct sanctions lists lag.
For instance, under the 20th package, monitoring digital ruble on-ramps means tracing conversions from sanctioned banks. Graph tools visualize these paths, prioritizing risks via scores blending volume, recency, and centrality metrics. Compliance pros gain intuitive dashboards: heatmaps of exposure, timelines of evasion attempts.
This isn't theoretical. Firms using advanced heuristics now screen billions in daily volume, clustering wallets with 95% accuracy on illicit ties. As the package looms, delaying adoption risks violations; the EU's anti-circumvention clauses brook no excuses.
Delving deeper into crypto sanctions evasion detection, consider the evasion tactics proliferating post-19th package. Sanctioned entities fragment funds through chain-hopping, employing cross-chain bridges and privacy coins to obscure origins. Graph analytics counters this by applying PageRank-like centrality measures, spotlighting hub wallets that funnel Russian crude oil proceeds or digital ruble conversions. At Kytgraph. com, our heuristics integrate OFAC and EU lists dynamically, scoring wallets on a 0-100 risk scale where scores above 70 trigger automated alerts.
Regulatory nuance matters. The EU's anti-circumvention rules, embedded since package 14, hold firms liable for 'knowing or having reasonable cause to suspect' indirect dealings. Graph analytics furnishes that reasonable cause, logging audit trails for FinCEN or BaFin inquiries. In my practice, conservative risk thresholds, screening all inbound transactions over €1,000, have shielded clients from dawn raids.
Real-World Application: Heuristics and Risk Scoring in Action
Implement via API integrations: ingest blockchain data, run graph queries, output compliance reports. Kytgraph. com's platform processes 10 million transactions per minute, clustering with sub-second latency. Heuristics flag anomalies like rapid layering post-sanctions announcements, common in Russian oil barter schemes. Pair this with entity resolution, merging clustered wallets into super-nodes for holistic views.
Opinion: Too many firms cling to legacy tools, mistaking checkboxes for diligence. The 20th package's breadth, banning crypto-asset providers outright, forces a paradigm shift. Graph analytics isn't a luxury; it's the firewall between operational continuity and enforcement actions that cripple balance sheets.
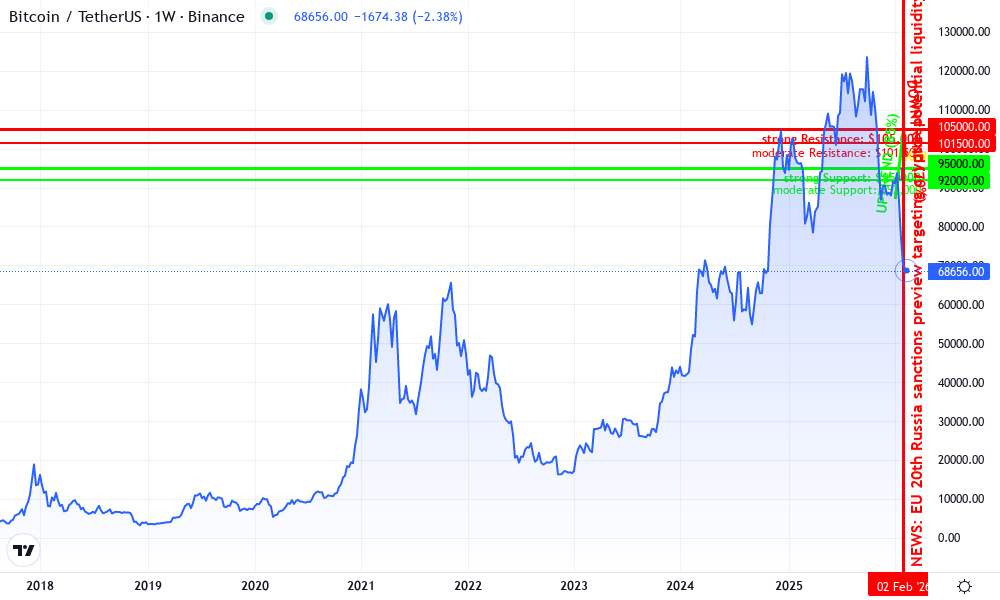
Bitcoin Technical Analysis Chart
Analysis by Patricia Langford | Symbol: BINANCE:BTCUSDT | Interval: 1W | Drawings: 8
Technical Analysis Summary
As Patricia Langford, apply conservative overlays: primary uptrend line from 2026-01-10 low to 2026-02-03 peak; horizontal lines at key support 95,000 and resistance 105,000; fib retracement from recent high to low; rectangle for early Jan consolidation; vertical line at 2026-02-05 for sanctions news impact; callouts on volume fade and MACD bearish cross; arrows for potential entry at support.
Risk Assessment: medium
Analysis: Geopolitical sanctions add macro volatility overlay to technical pullback; BTC tokenomics resilient but low tolerance favors waiting for confirmation
Patricia Langford's Recommendation: Hold cash or core positions; scale in longs only at 95k support with stops—preserve capital for sustainable liquidity plays.
Key Support & Resistance Levels
📈 Support Levels:
- $95,000 - Strong monthly low confluence with prior swing and 0.618 fib strong
- $92,000 - Secondary support from Jan volume cluster moderate
📉 Resistance Levels:
- $105,000 - Recent ATH rejection zone strong
- $101,500 - Intermediate resistance at 0.382 fib retrace moderate
Trading Zones (low risk tolerance)
🎯 Entry Zones:
- $95,000 - Confluence of trendline support, volume shelf, and fib level for low-risk long low risk
- $98,171 - Current pullback zone if volume picks up, conservative scalp medium risk
🚪 Exit Zones:
- $105,000 - Profit target at prior high resistance 💰 profit target
- $92,000 - Tight stop below key support 🛡️ stop loss
Technical Indicators Analysis
📊 Volume Analysis:
Pattern: fading on pullback
Volume declining on downside move, suggesting lack of conviction in selloff—bullish divergence
📈 MACD Analysis:
Signal: bearish crossover
MACD line crossed below signal amid sanctions news, but histogram contracting—watch for reversal
Applied TradingView Drawing Utilities
This chart analysis utilizes the following professional drawing tools:
Disclaimer: This technical analysis by Patricia Langford is for educational purposes only and should not be considered as financial advice. Trading involves risk, and you should always do your own research before making investment decisions. Past performance does not guarantee future results. The analysis reflects the author's personal methodology and risk tolerance (low).
Armed with these capabilities, teams simulate scenarios: What if a wallet clusters with A7A5 remnants? Freeze, report, unwind. Dashboards forecast exposure under pending rules, letting VPs sleep soundly. As von der Leyen's proposals crystallize, those wielding graph tools will navigate the storm, turning compliance from cost center to strategic moat.
Proactive compliance prevents punitive realities. Platforms like Kytgraph. com stand ready, fusing legal acumen with cutting-edge analytics to fortify your defenses against the sanctions tide.


No comments yet. Be the first to share your thoughts!