
In the intricate web of blockchain transactions, where pseudonymity shields illicit flows, graph analytics emerges as a conservative yet indispensable ally for sanctions KYT screening. As compliance demands intensify, clustering high-risk crypto wallets through sophisticated graph analytics KYT techniques allows institutions to map hidden connections, propagating risk signals across chains and exposing sanctions evasion tactics. This approach, rooted in transaction graphs, transforms raw blockchain data into actionable intelligence, safeguarding portfolios against regulatory pitfalls.

Transaction Proximity: Unveiling Hidden Risks in Wallet Networks
Consider the blockchain as a vast, dynamic graph, with wallets as nodes and transactions as edges weighted by value and recency. Recent research on transaction proximity quantifies the 'distance' between wallets, revealing how closely high-risk entities orbit legitimate ones. A pivotal study analyzed USDC wallets, finding a substantial portion within one hop of easily attainable identities, such as those tied to centralized exchanges. This metric underscores a sobering reality: fraudsters exploit short paths to launder funds, blending tainted assets into clean pools swiftly.
For compliance professionals, this proximity analysis refines sanctions wallet clustering. By prioritizing wallets near known sanctioned addresses or mixers, KYT systems flag clusters preemptively. At Kytgraph. com, we leverage such heuristics to visualize these proximities, enabling real-time risk scoring that aligns with OFAC and UN watchlists. The conservative investor appreciates this: it mitigates exposure without overreaching into benign activities.
Privacy-Preserving Federated Graph Learning Across VASPs
Data silos plague crypto compliance, yet sharing intelligence is vital for detecting cross-platform money laundering. Enter FedGraph-VASP, a framework where Virtual Asset Service Providers exchange compressed graph representations of boundary accounts, sans raw data. This federated approach preserves privacy while amplifying detection; neural networks trained on aggregated graphs identify anomalous patterns that solitary analyses miss.
In practice, this means high-risk crypto wallets interacting across exchanges trigger unified alerts. Imagine a wallet tainted on Ethereum migrating to Solana: risk propagates seamlessly. Our platform at Kytgraph. com integrates similar adaptive graph learning, addressing class imbalances in transaction data. Thoughtfully, this balances innovation with caution, ensuring institutions comply without compromising user trust.
Graph-Based Smurfing Detection and Adaptive Risk Heuristics
Smurfing, the fragmentation of illicit funds into micro-transactions, evades traditional thresholds. The GARG-AML framework counters this with second-order graph metrics, deriving interpretable smurfing risk scores from transaction subgraphs. Efficient and transparent, it slots into AML workflows, quantifying how wallets in dense clusters amplify laundering potential.
Complementing this, KYT screening heuristics evolve via relational network analysis. Platforms like TRM Labs exemplify blockchain intelligence powering real-time KYT, attributing entities and tracing cross-chain flows. Regulatory mandates from New York's DFS now compel banks to adopt such tools, signaling a shift toward graph-centric compliance. Conservatively, I advocate layering these with macro trend overlays; historical wallet data from Kytgraph. com reveals sanctions impacts, forecasting ecosystem vulnerabilities.
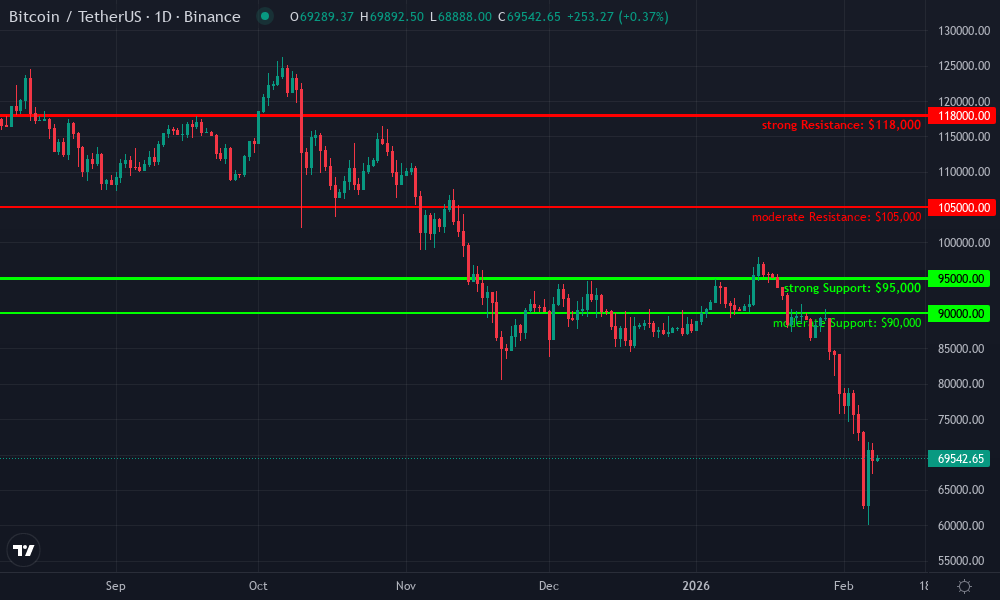
Bitcoin Technical Analysis Chart
Analysis by Market Analyst | Symbol: BINANCE:BTCUSDT | Interval: 1D | Drawings: 7
Technical Analysis Summary
On this BTCUSDT daily chart spanning late 2025 into early 2026 (focusing on Oct-Dec 2026), we observe a classic parabolic advance from October lows around $85,000, culminating in a sharp rejection at $118,000 in mid-December. The subsequent breakdown forms a descending channel, with price now testing major support near $95,000. Key observations: elevated volume on the upside buildup, now fading on downside; RSI (TA indicator) flashing oversold below 30, hinting at potential mean reversion. Balanced view: bulls retain control long-term, but short-term bearish momentum dominates. Drawing instructions: 1) Draw uptrend line from 2026-10-15 low ($85,200) to 2026-11-20 swing ($110,500), extend right. 2) Downtrend line from 2026-12-10 high ($118,000) to 2026-12-25 low ($95,300), extend. 3) Horizontal supports at $95,000 (strong) and $100,000 (moderate). 4) Fib retracement 0.618 from peak to trough for entry zone. 5) MACD bearish cross with volume spike callout on breakdown. 6) Rectangle consolidation Nov 1-15. Maintain medium risk sizing.
Risk Assessment: medium
Analysis: Volatile post-rally correction with oversold signals; medium tolerance suits dip buys but respects downside risk
Market Analyst's Recommendation: Scale in longs at support, trail stops; avoid overleverage amid regulatory overhang
Key Support & Resistance Levels
📈 Support Levels:
- $95,000 - Recent swing low + psychological round number strong
- $90,000 - 0.786 Fib extension from rally moderate
📉 Resistance Levels:
- $105,000 - 50% Fib retrace + prior consolidation high moderate
- $118,000 - All-time cycle high rejection strong
Trading Zones (medium risk tolerance)
🎯 Entry Zones:
- $95,500 - Bounce from strong support + RSI oversold divergence medium risk
- $102,000 - Break above channel resistance for continuation low risk
🚪 Exit Zones:
- $110,000 - Profit target at 38.2% Fib retrace 💰 profit target
- $92,000 - Stop below support structure 🛡️ stop loss
Technical Indicators Analysis
📊 Volume Analysis:
Pattern: fading on downside after spike on breakdown
Volume climax on Dec drop, now contracting – bullish divergence
📈 MACD Analysis:
Signal: bearish crossover with histogram contracting
MACD line below signal, but momentum waning – potential bullish cross soon
Applied TradingView Drawing Utilities
This chart analysis utilizes the following professional drawing tools:
Disclaimer: This technical analysis by Market Analyst is for educational purposes only and should not be considered as financial advice. Trading involves risk, and you should always do your own research before making investment decisions. Past performance does not guarantee future results. The analysis reflects the author's personal methodology and risk tolerance (medium).
These advancements illuminate the crypto sanctions graph, where clustering not only detects but anticipates risks. Continuous monitoring across 70 and blockchains, as seen in solutions from Chainalysis and NOMINIS. io, spots clean addresses brushing high-risk clusters. Yet, success hinges on nuanced implementation: overzealous flagging erodes efficiency, while under-detection invites fines.
Cross-chain risk propagation models address this tension head-on. When tainted funds leap from Ethereum to Binance Smart Chain, traditional volume checks falter; graph analytics persist the risk label through entity clustering. Platforms like ChainUp advocate this propagation, ensuring KYT screening heuristics span ecosystems without blind spots. At Kytgraph. com, our heuristics cluster wallets by behavioral fingerprints, from mixer hops to exchange deposits, yielding risk scores that evolve with macro sanctions shifts.
Best Practices: Layering Graph Analytics into KYT Workflows
Institutions must integrate graph tools judiciously, starting with entity resolution to de-anonymize clusters. BitOK's interactive visualizations exemplify this, mapping transfers for swift risk triage. Pair proximity metrics with smurfing scores; a wallet one hop from a sanctioned entity, fragmenting outflows, warrants immediate scrutiny. NOMINIS. io's monitoring across 70 and blockchains illustrates the payoff: clean addresses pinged by high-risk peers light up in real time.
Best Practices for Graph KYT Clustering
- Transaction Proximity Analysis: Measure wallet distances in transaction graphs to cluster those near high-risk entities like sanctioned addresses, as shown in recent studies where many large USDC wallets are one hop from identifiable sources. Learn more
- Cross-Chain Risk Propagation: Flag and propagate sanctions risks across blockchains when tainted funds move, ensuring clustered high-risk wallets are tracked regardless of chain. ChainUp guidance
- Federated Graph Learning: Apply FedGraph-VASP for VASPs to collaboratively cluster laundering risks via privacy-preserving graph representations without sharing raw data. Details

- Adaptive Graph Learning: Integrate relational network analysis to address data silos and identify high-risk clusters in large transaction networks. Research

- Graph-Based Smurfing Detection: Use GARG-AML metrics on second-order networks to quantify and cluster smurfing risks tied to sanctions evasion. Paper

- Blockchain Intelligence Platforms: Employ tools like TRM Labs for entity clustering, risk scoring, and cross-chain tracing in sanctions KYT. TRM Labs

Regulatory tailwinds reinforce these steps. New York's DFS mandates blockchain analytics for banks, while OFAC's crypto advisories spotlight mixer risks. H3M Analytics screens addresses against global watchlists, but graph layers add depth, tracing upstream sources. Conservatively, I counsel phased rollouts: pilot on high-volume chains, validate against historical breaches, then scale. This low-risk path aligns compliance with operational resilience.
Elementus shifts the paradigm from static KYC to dynamic KYT, analyzing flows for illicit signatures. Phalcon's wallet screening embeds similar graph smarts, enforcing AML/CFT via real-time flagging. Yet pitfalls loom: noisy data from DeFi yields false positives, eroding trust. Adaptive learning, as in the customer intelligence framework, counters this by tuning to network imbalances, prioritizing true threats.

TRM Labs powers this with entity attribution and cross-chain traces, integrating into workflows seamlessly. As macro trends shift, historical Kytgraph. com data forecasts impacts: sanctions waves ripple through graphs, devaluing exposed holdings. Institutions blending these tools construct resilient stacks, sidestepping fines that dwarf crypto volatility.
Graph analytics for clustering high-risk wallets stands as a bulwark in sanctions KYT screening. Thoughtfully deployed, it unmasks pseudonymous threats, propagates cautions across chains, and aligns blockchain's promise with prudent governance. Compliance professionals, equipped thus, navigate regulatory seas with steady hands, preserving capital amid inevitable tides.


No comments yet. Be the first to share your thoughts!